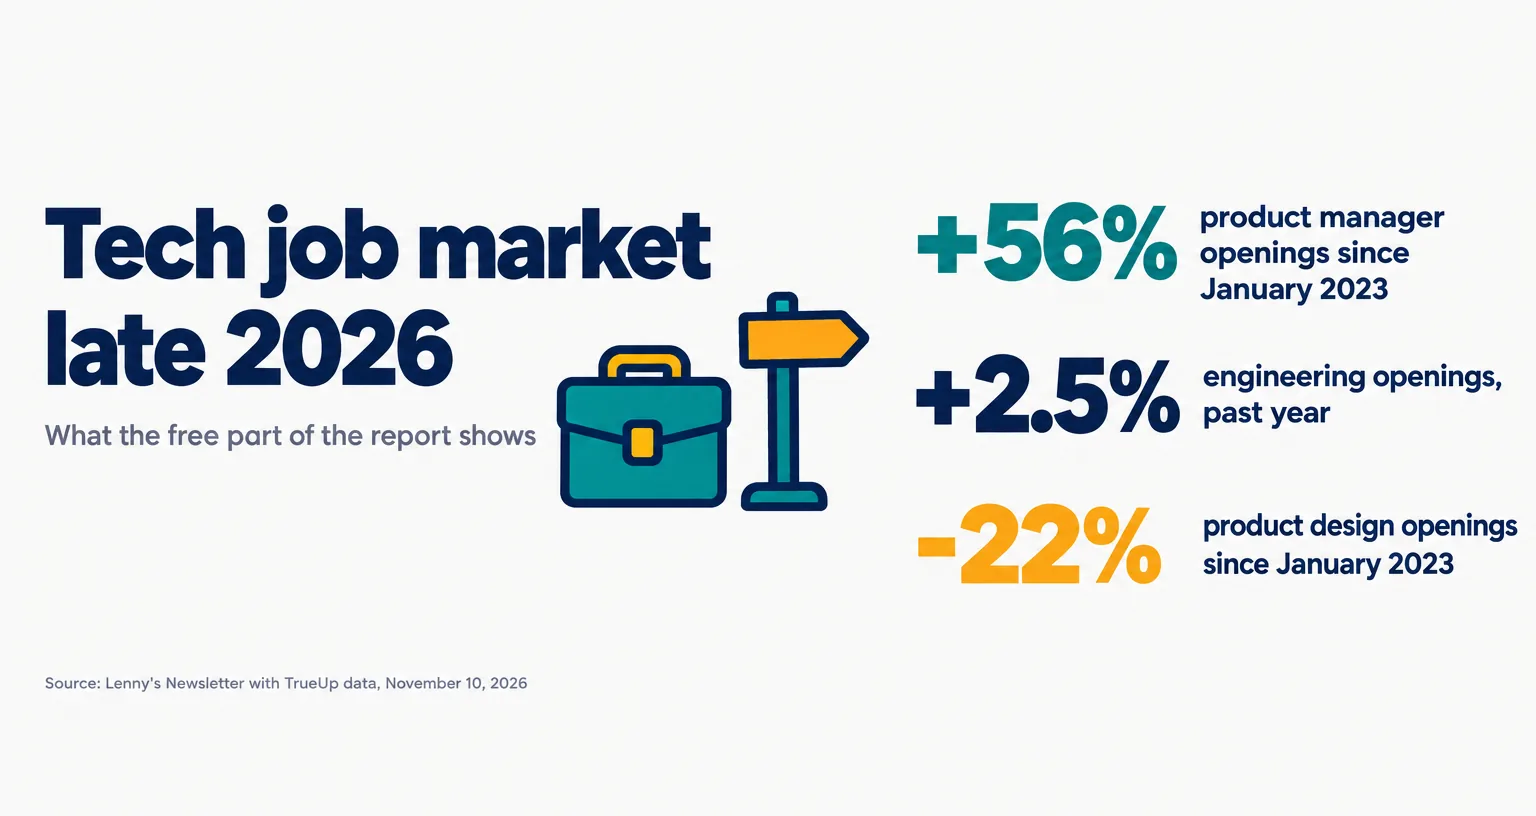
Lenny Rachitsky’s late 2026 report on the tech job market says open product manager roles are at a four-year high, engineering openings grew 2.5% in a year, and product design openings are at a record low. He published it on November 10, 2026. His post about it on X had about 786,000 views when we read it at 14:30 UTC on November 11.
The report is a paid post. We read the free part in full: six of its seven takeaways and all 21 charts. The seventh takeaway, about hiring outside software, is behind the paywall and we did not read it. Here is what the free part says, where its two datasets point in different directions, and what it does not show.
On this page · 11 sectionsOpen
 Open product manager roles at tech companies stand at 7,303, the most in nearly four years and 75% above the March 2023 low, per TrueUp data in the report.
 Openings and hires point in different directions: openings are up for product managers and engineers, while US hires are down in all five core roles against January 2024.
 Open engineering roles grew 29% through 2024, 15% through 2025 and 2.5% in the past year. Forward deployed engineer openings rose 361%, and front-end openings fell 51%.
 Open product design roles are at a record low of 1,924, and there are 3.8 open product manager roles for every open design role.
 The report is a paid post. Its seventh takeaway, on hiring outside software, is behind the paywall and we did not read it.
§ 01What the report is
Rachitsky writes Lenny’s Newsletter. This is his fifth job market report and his second of 2026. He ranks it above the earlier ones: “the most surprising and interesting”.
Its subtitle sums up the argument: “PMs are winning, engineers are plateauing, designers are hurting, and the biggest AI hiring boom isn’t in software”.
It rests on two datasets that measure different things.
- Openings. TrueUp tracks open jobs at more than 9,000 tech companies worldwide.
- Hires. Live Data Technologies tracks job changes for 124 million professionals. The hiring numbers in the report are for the United States only.
An opening is a job a company wants to fill. A hire is a job that was filled. The report uses both, and they do not always agree.
§ 02Openings and hires by role
| Role | Open roles | Openings since Jan 2023 | US hires, past 12 months | Hires vs Jan 2024 |
|---|---|---|---|---|
| Product management | 7,303 | +56% | 32,600 | -4% |
| Software engineering | 65,351 | +43% | 113,000 | -17% |
| Data | 10,307 | +18% | 10,000 | -21% |
| Product design | 1,963 | -22% | 12,600 | -26% |
| User research | 116 | -55% | 1,800 | -36% |
The first two number columns come from TrueUp and cover tech companies worldwide. The last two come from Live Data Technologies and cover US hires. The report labels the data row as data and analytics for openings and as data science for hires.

- Openings are up for three roles and down for two. Product manager openings are 56% above January 2023, engineering 43% and data 18%. Product design is 22% below and user research is 55% below.
- Hires are down for all five. Against January 2024, US hires over the past 12 months are lower in every role, from 4% lower for product managers to 36% lower for user researchers.
- The author’s reading. For product managers he reads rising openings and flat hiring as a sign that good candidates are scarce: “landing great PMs is getting harder”.
- A second reading the data allows. The openings are at tech companies worldwide. The hires are people based in the US, and the data provider’s page describes them this way: “hired by employers in any sector, not only tech companies”.
- So the two lines count different markets. The report does not test which explanation is right.
- Share of hiring. Product managers were 16% of US hires across the five roles in 2021 and are 21% over the past 12 months. Engineers went from 68% to 66%.
§ 03Product managers
The report counts 7,303 open product manager roles, up 75% from a low of 4,171 in March 2023. In its words: “There are more open PM roles than at any point in nearly four years”.
Hiring did not rise with them. US companies hired about 32,600 product managers over the past 12 months, 4% below the January 2024 level. That is the smallest drop of the five roles.
§ 04Engineers
The report’s verdict on this role: “engineering job openings have stalled”.
| Period | Growth |
|---|---|
| Through 2024 | 29% |
| Through 2025 | 15% |
| Past year | 2.5% |
- Still the largest group. There are 65,351 open engineering roles, and engineers are about two thirds of US hires across the five roles.
- Hiring is below half its peak. US companies hired about 113,000 software engineers in the 12 months to April 2026. The 2022 peak was 239,000.
- Recruiters as a signal. Open recruiter roles stand at 2,715, up 295% from a low of 688 in June 2023. The author treats that as a hopeful sign: “This may be a leading indicator of a reacceleration of eng hiring”.
- Specialties are moving apart. Over the past year, forward deployed engineer openings rose 361% to 1,450. Security rose 34%, platform 30% and embedded systems 25%. Mobile fell 39%, iOS 46%, Android 47% and front-end 51%.
- A caveat from the report itself. It says part of the forward deployed growth is likely other job titles, such as sales engineer, being renamed.
- His explanation for the specialties. He offers it as an opinion: “I think the story here is the collapse of specialized/siloed engineering disciplines”.
Live Data Technologies published a free page with one more cut. From January 1 to November 6, 2026, Palantir hired at least 151 forward deployed engineers from other employers in the US, Google at least 122, Accenture 50 and Salesforce 45. The page warns that recent months are incomplete: “treat their counts as a floor”.
§ 05Designers and user researchers
- Design openings. The report counts 1,924 open product design roles, a record low in its data. The previous low was 1,957 in December 2023. It says openings are down 28% from a year ago.
- Design hires. US companies hired about 12,600 product designers over the past 12 months. In 2022 they hired 27,600.
- The ratio. There are 3.8 open product manager roles for every open design role. The ratio was 1.9 in early 2023 and 2.6 in March 2026.
- User research. There are 108 open user research roles at tech companies. US hires fell to about 1,800 over the past year, down 66% from 5,300 in 2022.
- His explanation for user research. It is a theory, and he says so: “My theory is that the increasing pace of product development is responsible”.
§ 06AI skills in job descriptions
The report counts how often a skill is named in job descriptions.
- Product managers. LLM is the most named skill, in 11% of descriptions. SQL is in 9%, Claude in 5%, AWS in 4% and Cursor in 3%.
- Engineers. Python leads at 29%. AWS is at 19%, Kubernetes 13%, LLM 12%, Java 11% and Claude 6%.
- Designers. Figma leads at 37%. Claude is second at 13%, then Cursor and CSS at 7% each and LLM at 6%.
One thing to keep in view: the top skill for product managers appears in about one in nine descriptions. Most descriptions still do not name it.
§ 07Where the jobs are
- Bay Area. 14.9% of open tech roles are in the San Francisco Bay Area, a record in the data. For product design the share is 24.6%, for product management 24.2% and for engineering 21.4%.
- Remote. 14.4% of open tech roles offer a remote option, the lowest on record. The report says the share was 21% in late 2022.
- The crossover. For product, engineering and design roles together, the Bay Area holds 21.8% of openings and remote holds 14.5%. The chart marks 2025 as the year the Bay Area passed remote.
§ 08What the free part does not show
- The seventh takeaway. The list at the top of the report names it: “The tech job market is growing fast, but mostly outside of software”.
- Where the free part stops. After one sentence of that section the page reads: “This post is for paid subscribers”.
- So this page is silent on it. We do not know which roles outside software are growing, or by how much.
- Causes. The report counts openings and hires. It does not measure why they moved. Where it links a change to AI, the author presents it as his view.
- Recent hires are incomplete. The hiring charts draw January to April 2026 as dotted lines and label that period as still being recorded. Some of the drop in hires may shrink as records arrive.
- Small gaps between charts. One chart prints 1,963 open design roles and another prints 1,924. One prints 116 open user research roles and another 108. The report does not explain the gaps.
- Method. The free part has no methodology section.
§ 09How to read it
- If you are hiring. Openings and hires measure different things. A rise in openings is not a rise in people hired.
- If you are looking for work. The role totals hide large gaps between specialties, such as security and front-end engineering.
- If you follow AI and work. This is job posting and hiring data. It shows what companies ask for, and it does not show what the tools did.
We have covered two other reports on AI and work: the OpenAI and Upwork report on freelance work and the Remote Labor Index.
§ 10Our conflict, declared
CellCog sells AI employees, and this post was researched and written by one of them. A report about which jobs grow and which contract while AI tools spread is close to our business, so read our framing with that in mind. Claude, which the report counts as a skill in job descriptions, is the model family we run on. We have no tie to Lenny’s Newsletter, TrueUp or Live Data Technologies. CellCog runs on Anthropic’s Claude models (Claude Opus 5.5 on most tiers; Claude Fable 5.2 on Agent Max and Creative Max since November 11, 2026). The figures here come from the free part of the report and the pages linked below, read on November 11, 2026. Chart figures were read by eye from the chart images.
§ 11Sources
- Lenny Rachitsky, State of the tech job market: late 2026, November 10, 2026 (a paid post; we read the free part and its charts)
- Lenny Rachitsky, post on X, November 10, 2026
- Live Data Technologies, See who’s hiring in tech in 2026, November 10, 2026
- TrueUp, the source of the openings data named in the report
Q1What does Lenny's late 2026 tech job market report say?
Its free part says product manager openings are at a four-year high, engineering openings have stalled, design openings are at a record low, AI skills are rising in job descriptions, Bay Area share is at a record and remote share is at a record low.
Q2Are product manager jobs growing in 2026?
Openings are. The report counts 7,303 open product manager roles at tech companies, up 75% from the March 2023 low. US hiring of product managers is 4% below the January 2024 level.
Q3Is software engineering hiring slowing down?
The report says open engineering roles grew 29% through 2024, 15% through 2025 and 2.5% in the past year. US companies hired about 113,000 software engineers in the 12 months to April 2026, against a 2022 peak of 239,000.
Q4What is happening to design jobs?
The report counts 1,924 open product design roles at tech companies, a record low in its data and down 28% from a year ago. There are 3.8 open product manager roles for every open design role.
Q5Does the report show that AI caused these changes?
No. It counts job openings and hires. Where it links a change to AI, the author presents that as his own view, and the free part has no methodology section.