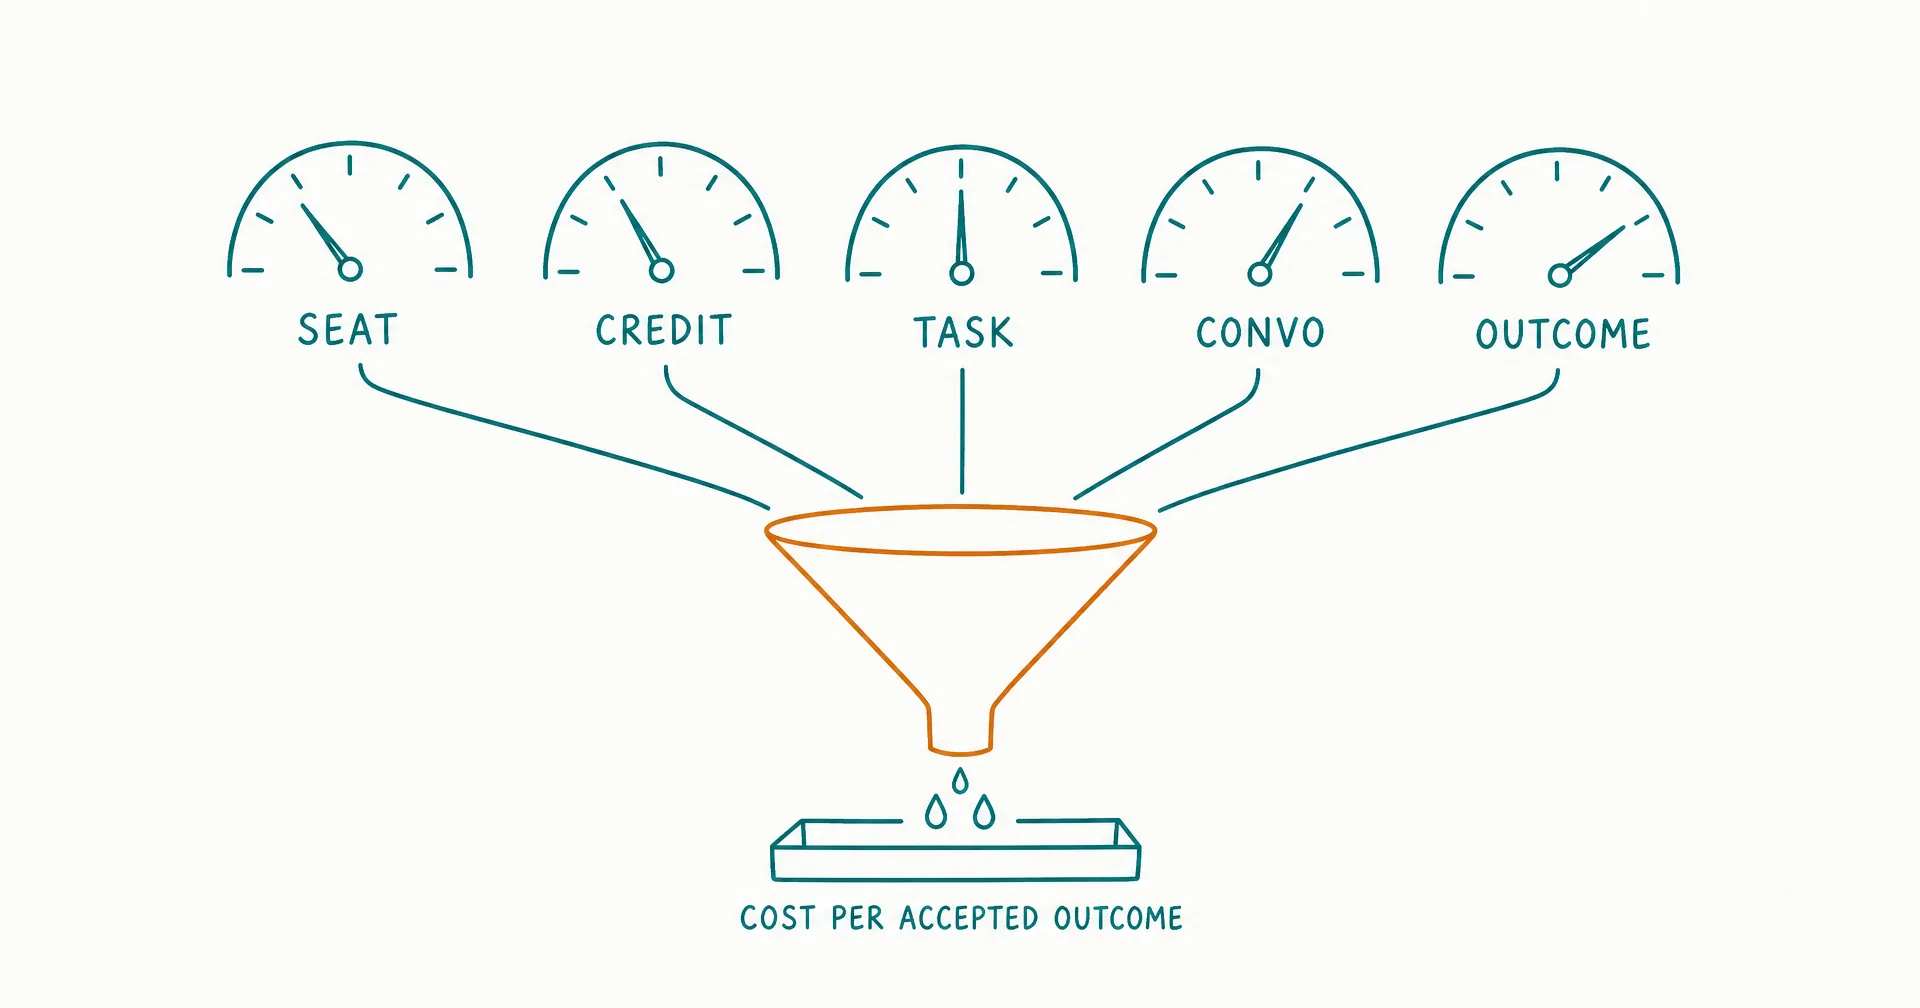
AI employee pricing can be based on access, people, technical consumption, workflow events, or a vendor-defined result. The invoice may call the unit a seat, credit, token, task, run, action, message, conversation, resolution, or outcome.
Those units are not interchangeable.
A seat can include usage. A credit can represent different operations. One business task can trigger several runs, and one run can use several actions, model calls, tools, and retries. An outcome price can look simple while its billable definition excludes or includes cases you did not expect.
The reliable way to compare AI employee pricing is to normalize every quote to the same role, workload, operating pattern, acceptance standard, human-review policy, and expected growth case.
Do not ask only, “What does one credit cost?” Ask, “What will this role cost per accepted outcome under normal, heavy, and failure conditions?”
On this page · 11 sectionsOpen
- What Are the Main AI Employee Pricing Models?
- How Do You Define a Billable Unit Before Comparing Prices?
- When Are Subscription and Seat Models Predictable?
- How Do Credit and Token Models Work?
- How Do Task, Run, Action, and Message Models Differ?
- Are Conversation and Outcome Models More Aligned With Value?
- How Do Commitments, Overage, and Hybrid Pricing Change the Budget?
- How Do You Normalize Different Vendor Quotes?
- Which Pricing Model Is Most Predictable?
- What Should Procurement Ask About AI Employee Pricing?
- How Should Buyers Evaluate CellCog’s Credit Pricing?
- AI employee platforms commonly combine subscription, seat, credit/token, task/run, action/message, conversation, outcome, and enterprise-commitment pricing.
- The billing unit is a commercial meter, not automatically a business result. Define precisely what starts it, ends it, multiplies it, and makes it billable.
- Normalize quotes with a workload tree: eligible items x coverage x runs per item x actions or credits per run x unit price.
- Add fixed platform cost, minimum commitments, overage, third-party tools, unused capacity, review, correction, monitoring, and expected failure cost.
- Compare cost per accepted outcome, not cost per generated item or the smallest advertised unit.
- Model normal, high-volume, low-acceptance, retry-heavy, and event-storm scenarios. A predictable model has understandable variance and enforceable controls.
- Verify the platform’s live pricing terms and selected plan on the purchase date; use an evergreen framework rather than copying a price that can change.
§ 01What Are the Main AI Employee Pricing Models?
The main models charge for one of 5 commercial objects: access, capacity, activity, interaction, or result.
| Pricing family | Common unit | What the vendor meters | Buyer’s main question |
|---|---|---|---|
| Access | Subscription, workspace, organization | Right to use the product and included features | What is included before usage charges begin? |
| User | Seat, user, teammate | Number or type of people with access | Which users require paid seats? |
| Capacity | Credits, tokens, compute, storage | Technical resources consumed | How does the role convert work into capacity? |
| Activity | Task, run, action, tool call, message | A workflow or system event | How many billable events does one case create? |
| Interaction | Conversation, session, minute | A bounded exchange or channel period | What opens, closes, or reopens the unit? |
| Result | Resolution, qualification, completed outcome | Vendor-defined completion | Does the billable result match your acceptance rule? |
| Commitment | Annual pool, prepaid capacity, minimum spend | Reserved commercial capacity | What happens to unused or excess usage? |
| Hybrid | Any combination above | Several meters together | Which meter dominates at your workload? |
Most production quotes are hybrid.
A platform might charge a workspace subscription, 6 paid seats, pooled credits, external-model usage, storage, premium connectors, and overage. Another may charge no platform fee but require a minimum number of outcomes. A third may provide unmetered employee use for licensed people while metering autonomous or customer-facing actions.
The label alone is therefore insufficient. “Credit pricing” can behave like predictable prepaid capacity or unpredictable consumption. “Outcome pricing” can align payment with value or create disputes about what counts.
Price is a function, not a number
Write each quote as a function:
Monthly vendor cost = fixed access + seats + committed capacity + variable usage + add-ons + overage - credits/discounts
Then add the operating layers from the AI employee total-cost framework:
Total role cost = vendor cost + setup + integrations + review + correction + monitoring + expected failure cost
This prevents a clean-looking unit price from hiding the cost of producing accepted work.
§ 02How Do You Define a Billable Unit Before Comparing Prices?
Request the billing specification, rate card, or contract language for every meter.
For each unit, answer 10 questions:
- What exact event creates the unit?
- Is the trigger, response, action, or completed workflow counted?
- Can one user request create several units?
- Do retries, fallbacks, tests, errors, or abandoned work count?
- Does model or tool choice change the multiplier?
- When does a conversation or session close and reopen?
- Is usage rounded up at the request, day, or billing-period level?
- Are units pooled across roles, workspaces, or legal entities?
- Do unused units expire, roll over, or receive a credit?
- What happens at the limit: stop, throttle, upgrade, or overage?
Build a meter dictionary
| Contract term | Vendor definition | Buyer interpretation | Evidence needed |
|---|---|---|---|
| Credit | Unit consumed by specified modes or operations | Technical capacity, not output | Rate card by operation |
| Task | Successful billable workflow action | Activity event | Trigger/action counting rules |
| Run | One workflow or agent execution | May contain several steps | Start/end and retry rules |
| Action | Defined function performed by an agent | Atomic platform event | Action catalog and multiplier |
| Conversation | Exchange within a defined boundary | Interaction window | Open/close/reopen rules |
| Outcome | Vendor-defined successful result | May differ from buyer acceptance | Billable outcome taxonomy |
| Seat | Licensed user category | Access, not usage | Seat types and permissions |
Do not substitute your ordinary-language meaning for the contract meaning.
For example, a buyer may call a customer issue “resolved” only after 7 days without reopening. A vendor may count an outcome when the customer does not request more help within the conversation. Both definitions can be internally valid, but they are different economic units.
Map business work to billing events
Create a trace for one representative case:
Eligible case → trigger → run → model calls → retrieval → tool actions → review → retry/correction → accepted outcome
Mark every billable point. Repeat for an easy case, a difficult accepted case, an escalated case, a rejected case, and a system failure.
The trace exposes whether one “task” in the role becomes 1 task, 7 actions, 3 model calls, 2 tool fees, and 1 human review on the invoice.
§ 03When Are Subscription and Seat Models Predictable?
Subscription pricing charges for access to a plan, workspace, organization, or capacity bundle. Seat pricing charges by licensed person or user category.
They are most predictable when:
- the recurring fee is known;
- included capacity is sufficient;
- paid seat rules match real access needs;
- usage does not vary materially by role;
- overage is controlled;
- add-ons are identified; and
- unused capacity is acceptable.
Subscription strengths and risks
| Subscription feature | Advantage | Budget risk |
|---|---|---|
| Fixed recurring amount | Simple base forecast | Can hide variable layers |
| Included usage | Low marginal cost within bundle | Underuse raises effective unit cost |
| Feature tiers | Clear packaging | Required control may force a higher tier |
| Annual discount | Lower contracted rate | Longer commitment and switching exposure |
| Shared pool | Flexible allocation | One role can consume another’s capacity |
| Upgrade path | Growth can be forecast | Tier cliffs create step changes |
Calculate both utilization and effective rate:
Utilization = consumed included units ÷ purchased included units
Effective price per consumed unit = subscription cost ÷ consumed included units
A $1,000 bundle with 100,000 included units has a nominal $0.01 price per included unit. If the team uses 40,000:
$1,000 ÷ 40,000 = $0.025 per consumed unit
The nominal rate is useful for capacity. The effective rate is useful for economics.
Seat strengths and risks
Seat pricing is attractive when human access drives product value and usage is meaningfully included. It is weaker when:
- many occasional reviewers need full seats;
- different seat types have unclear permissions;
- autonomous work also consumes usage units;
- contractors or external collaborators create license complexity;
- minimum seats exceed the operating team; or
- a seat is required merely to approve an AI action.
Use:
Monthly seat cost = paid seats × monthly price per seat
Then segment paid people:
| Person type | Count | Access need | Required seat type | Monthly cost |
|---|---|---|---|---|
| Role owner | 1 | Build and manage | Full | Quote |
| Reviewer | 4 | Review and approve | Full or reviewer | Quote |
| Executive viewer | 3 | Dashboard only | Viewer or free | Quote |
| Administrator | 2 | Security and billing | Admin | Quote |
| Occasional specialist | 8 | Exception review | Guest, reviewer, or full | Quote |
Ask whether a named user can perform more than one role, whether seats can be reassigned, and when changes take effect.
§ 04How Do Credit and Token Models Work?
Credits abstract one or more technical costs into a vendor-controlled unit. Tokens meter text or multimodal input, cached input, output, and sometimes reasoning or tool-related usage.
The benefit of abstraction is a simpler commercial currency. The risk is that buyers may not see how work becomes spend.
Credit conversion
Use:
Credits per accepted outcome = total role credits ÷ accepted outcomes
Credit cost per accepted outcome = credits per accepted outcome × effective price per credit
But first identify:
- credits per mode;
- credits per model or capability;
- credits per tool/action;
- different input and output rates;
- media, browsing, code, or computer-use multipliers;
- retries and fallback consumption;
- rounding;
- pooled usage;
- rollover/expiry;
- top-up rate; and
- balance or spend controls.
Microsoft’s current Copilot Studio billing documentation illustrates why “credit” needs a rate card: different answers, actions, grounding, flows, tools, tokens, and voice tiers can consume different quantities, and one interaction can combine several feature types.
Token economics
A simple token forecast is:
Model cost = input tokens × input rate + cached input tokens × cached rate + output tokens × output rate
An agentic workflow can add:
- orchestration calls;
- planning turns;
- retrieval context;
- tool definitions;
- tool results;
- reflection or evaluation calls;
- fallback models;
- safety classifiers;
- embeddings;
- memory reads/writes; and
- repeated attempts.
Tokens are excellent engineering signals but weak business denominators. A cheaper token does not guarantee a cheaper accepted outcome if the workflow uses more tokens, fails more often, or requires more correction.
Credit-pool scenarios
| Scenario | Purchased credits | Consumed credits | Top-up credits | Expired credits | Economic issue |
|---|---|---|---|---|---|
| Balanced | 100,000 | 92,000 | 0 | 8,000 | Moderate unused capacity |
| Underused | 100,000 | 40,000 | 0 | 60,000 | High effective rate |
| Spiky | 100,000 | 125,000 | 25,000 | 0 | Overage/top-up exposure |
| Misallocated | 100,000 | 100,000 | 15,000 for priority role | 0 | Shared pool exhausted by another role |
| Retry-heavy | 100,000 | 100,000 | 20,000 | 0 | Quality failure drives spend |
The right plan is not necessarily the bundle with the lowest nominal credit rate. It is the plan with the best effective economics and acceptable downside for the actual workload.
§ 05How Do Task, Run, Action, and Message Models Differ?
These models charge for activity, but the granularity changes.
| Unit | Typical meaning | Multiplication risk | Control |
|---|---|---|---|
| Task | One billable automation action or completed step | Multi-step workflows create many tasks | Map steps and exclusions |
| Run | One execution of a workflow or agent | Retries and child runs multiply | Idempotency and retry limit |
| Action | One defined function | One case needs several actions | Action budget per case |
| Tool call | One external function request | Loops and redundant calls | Tool-call ceiling and cache |
| Message | One request/response event | Long interactions create many messages | Conversation design |
| Page/minute | Content or voice consumed | Long documents/calls increase usage | Size/duration controls |
A task is vendor-specific
Zapier’s current pay-per-task documentation describes additional task billing after plan capacity and a maximum usage limit. That behavior is specific to Zapier, but it demonstrates the procurement questions every task-based quote needs: what counts, what happens at the plan limit, who can enable overage, and where usage is visible.
An action can be more granular than a conversation
Salesforce’s current Agentforce pricing page presents several commercial units, including action-oriented Flex Credits, conversations, and user licensing. The page also shows examples in which a use case contains multiple actions.
That does not make action pricing inherently expensive or cheap. It makes workflow shape economically important.
Use:
Monthly action cost = eligible cases × AI coverage × actions per case × price per action
If accepted cases need 4 actions, rejected cases need 3, and escalated cases need 2:
Total actions = accepted cases × 4 + rejected cases × 3 + escalated cases × 2
Add retries separately. Do not assume unsuccessful work is unbilled.
Scheduled roles can create idle or duplicate activity
Persistent roles may run on a shift and schedule, react to events, poll queues, and resume unfinished work. Price:
- scheduled runs with no eligible work;
- duplicate triggers;
- polling;
- overlapping shifts;
- retries after timeouts;
- handovers;
- monitoring actions; and
- maintenance or test traffic.
One incorrectly configured trigger can change spend without creating more accepted outcomes.
§ 06Are Conversation and Outcome Models More Aligned With Value?
They can be, but only when the commercial definition matches the buyer’s definition of useful completion.
Conversation pricing
Conversation pricing can reduce sensitivity to the number of messages or actions inside one interaction. It becomes less predictable when:
- the open/close window is unclear;
- a customer returns after the window;
- channels use different rules;
- one issue spans several conversations;
- handoff opens another paid unit;
- proactive and reactive interactions differ; or
- internal and external use have different meters.
Ask for examples of:
- one issue solved in 2 messages;
- one issue solved in 20 messages;
- one issue reopened after 1 hour;
- one issue reopened after 2 days;
- one conversation covering 2 issues;
- one failed conversation escalated to a person.
Outcome pricing
Outcome pricing moves the billable point closer to business value. However, “outcome” remains a contract term.
Intercom’s current pricing FAQ defines several Fin outcome types and also lists cases that are not charged. That specificity is useful: buyers can compare the vendor’s billing event with their own resolution, qualification, or acceptance rule.
Use a reconciliation table:
| Case | Vendor says billable outcome? | Buyer says accepted outcome? | Treatment |
|---|---|---|---|
| Correct answer, no reopen | Yes | Yes | Aligned |
| Correct procedure handoff | Yes | Yes or partial | Define value |
| Customer leaves but answer is wrong | Possibly | No | Dispute/quality exposure |
| Human finishes after weak AI attempt | Depends | No or shared | Define attribution |
| Correct escalation | Maybe not | Yes as controlled outcome | Operational value, possibly unbilled |
| Duplicate interaction | Depends | One accepted outcome | Reconcile duplicates |
Outcome pricing can transfer or create risk
The vendor assumes some risk when failed attempts are unbilled. The buyer may still incur:
- platform minimums;
- human review;
- correction;
- customer harm;
- tool or channel fees;
- escalation labor;
- delayed resolution; and
- integration/operations cost.
Paying only for a vendor outcome does not mean the full business cost exists only when that outcome occurs.
§ 07How Do Commitments, Overage, and Hybrid Pricing Change the Budget?
Commercial terms can matter more than the advertised rate.
| Term | Buyer advantage | Buyer risk | Evidence |
|---|---|---|---|
| Pre-purchase | Lower rate and known capacity | Upfront cash and unused units | Expiry/rollover terms |
| Minimum commitment | Access to negotiated terms | Pay even at low adoption | Minimum invoice |
| Pay as you go | Flexible start | Higher or variable unit rate | Rate card |
| Overage | Work continues | Surprise spend | Overage formula and cap |
| Hard stop | Spend ceiling | Business interruption | Enforcement behavior |
| Tiered volume | Lower marginal rate | Cliff or commitment | Band calculation |
| Annual contract | Discount and terms | Lock-in | Renewal/termination |
| Pooled capacity | Flexible allocation | Noisy neighbor role | Allocation and alerts |
| True-up | Usage reconciled later | Delayed liability | Timing and price |
Model committed, effective, and marginal rates
Committed unit rate = committed price ÷ committed units
Effective unit rate = total invoice ÷ consumed units
Marginal unit rate = cost of the next unit or usage band
All 3 matter.
A low committed rate can coexist with a high effective rate when adoption is weak. A favorable effective rate can coexist with an expensive marginal rate when the role is near its limit.
The FinOps Foundation’s FinOps for AI framework distinguishes pricing units from consumed units and highlights the need to reconcile granular AI usage - tokens, calls, and outcomes - with cost and business value.
Price the downside
For every quote, calculate:
- unused-capacity cost at 50%, 75%, and 90% utilization;
- overage cost at 110%, 125%, and 150% of forecast;
- cost if first-pass acceptance falls 10 points;
- cost if retries double;
- cost if reviewer demand rises 25%;
- cost of adding a required security or administration seat; and
- cost of exit before the contract ends.
Predictability is not the absence of variable pricing. It is the ability to explain and limit the variance before the invoice arrives.
§ 08How Do You Normalize Different Vendor Quotes?
Create one workload specification and force every quote through it.
Step 1: Define the role workload
Illustrative monthly workload:
| Workload input | Normal case | High case |
|---|---|---|
| Eligible items | 1,000 | 1,500 |
| AI coverage | 90% | 95% |
| Runs per covered item | 1.15 | 1.30 |
| Actions per run | 4.0 | 4.8 |
| First-pass acceptance | 82% | 72% |
| Final accepted outcomes | 800 | 1,050 |
| Review hours | 40 | 68 |
| Correction hours | 18 | 36 |
The high case has more work and worse process efficiency. That is deliberate. A volume-only high case understates the cost of scaling.
Step 2: Translate into each meter
Covered items = eligible items × AI coverage
Normal case:
1,000 × 90% = 900 covered items
Runs = 900 × 1.15 = 1,035 runs
Actions = 1,035 × 4.0 = 4,140 actions
Then map:
| Quote type | Monthly billable quantity |
|---|---|
| Per covered task | 900 tasks |
| Per run | 1,035 runs |
| Per action | 4,140 actions |
| Per conversation | Observed conversation count |
| Per outcome | Vendor-defined billable outcomes |
| Credit | Sum of mode/action multipliers |
| Seat | Required paid users by type |
Do not infer conversation or outcome count from covered tasks unless the definitions support it.
Step 3: Calculate an illustrative quote
The following rates are fictional and exist only to show normalization.
| Quote | Commercial terms | Normal vendor cost | High vendor cost |
|---|---|---|---|
| A: seats + usage | $120 x 5 seats + $0.40/run | $1,014 | $1,563 |
| B: credits | $1,000/100k included; 25 credits/action; $0.012 overage credit | $1,242 | $2,835 |
| C: tasks | $0.90/task, $600 minimum | $810 | $1,283 |
| D: actions | $0.18/action | $745 | $1,601 |
| E: outcomes | $1.30/vendor outcome; 850/1,180 billable | $1,105 | $1,534 |
For Quote B normal:
4,140 actions × 25 credits = 103,500 credits
Included cost = $1,000
Overage = 3,500 × $0.012 = $42
The table shows $1,242 because the fictional quote also includes a $200 workspace fee. Every fixed layer must remain visible.
Step 4: Add operating cost
Assume all quotes require:
- setup amortization: $500/month;
- integration/admin: $250/month;
- review: 40 hours × $50 = $2,000;
- correction: 18 hours × $50 = $900;
- monitoring: $300; and
- expected failure cost: $250.
Non-vendor operating cost = $4,200/month
| Quote | Vendor cost | Full monthly cost | Accepted outcomes | Full cost per accepted outcome |
|---|---|---|---|---|
| A | $1,014 | $5,214 | 800 | $6.52 |
| B | $1,242 | $5,442 | 800 | $6.80 |
| C | $810 | $5,010 | 800 | $6.26 |
| D | $745 | $4,945 | 800 | $6.18 |
| E | $1,105 | $5,305 | 800 | $6.63 |
The spread between the lowest and highest full cost is much smaller than the spread between vendor prices because review and correction dominate this example.
The detailed cost-per-accepted-outcome method should be the final normalization layer, while the AI employee ROI model tests whether the accepted work creates enough attributable value.
Step 5: Reconcile the first invoice to operating events
A quote calculator predicts cost. The first production invoice tests whether the pricing interpretation was correct.
Reconcile at 3 levels:
- Invoice: amount billed by SKU, unit, discount, tax, commitment, and overage.
- Platform: usage recorded by workspace, role, model, tool, user, and environment.
- Workflow: eligible cases, runs, actions, retries, reviews, and accepted outcomes.
The totals should connect:
Invoice units ≈ sum of platform usage under the contract rules
Platform usage ≈ sum of attributed workflow events plus explained shared/system usage
Small differences can come from rounding, timing, delayed records, taxes, or shared operations. Unexplained material differences need an owner and correction.
| Reconciliation field | Quote assumption | Actual | Variance | Explanation/action |
|---|---|---|---|---|
| Eligible items | 1,000 | 980 | -2.0% | Normal demand variance |
| Runs per item | 1.15 | 1.42 | +23.5% | Timeout retries; investigate |
| Actions per run | 4.0 | 4.1 | +2.5% | Within expected case mix |
| Billed credits | 103,500 | 129,400 | +25.0% | Retry and model-mode change |
| Vendor invoice | $1,242 | $1,553 | +25.0% | Usage variance |
| Accepted outcomes | 800 | 730 | -8.8% | Lower first-pass acceptance |
| Vendor cost/accepted outcome | $1.55 | $2.13 | +37.4% | Cost rose while useful output fell |
The final line is more informative than invoice variance alone. A 25% higher bill can be acceptable if accepted outcomes grew proportionally. It is a warning when accepted outcomes fall.
Separate price, usage, mix, and quality variance
Use 4 variance categories:
- Price variance: the effective unit price differs because of rate changes, discounts, overage, or commitment treatment.
- Usage variance: the same work consumes more billable units.
- Mix variance: more cases use expensive models, tools, channels, or actions.
- Quality variance: more work is rejected, corrected, reopened, or repeated.
For a simplified unit model:
Price variance = actual units × (actual unit price - budget unit price)
Usage variance = budget unit price × (actual units - budget units at actual workload)
Mix and quality need workflow segmentation rather than one blended equation. Separate easy, normal, difficult, escalation, and failed cases; then compare unit use and acceptance inside each group.
Without that separation, procurement may negotiate a lower rate while the operating team allows retries and low acceptance to erase the savings.
Reconcile non-billed operating events too
Not every economically important event appears on the invoice. Retain:
- unbilled failed runs;
- correctly escalated cases;
- reviewer time;
- correction time;
- customer or employee waiting time;
- incidents;
- unused prepaid capacity;
- plan-enforcement interruptions;
- manual work during outages; and
- tasks moved outside the platform.
These records explain why vendor spend and total role cost can move in different directions.
Set a close process
During a pilot, reconcile weekly. In stable production, complete a monthly close within 5 business days of receiving usage and billing data.
The close should produce:
| Output | Owner | Decision |
|---|---|---|
| Invoice-to-rate-card check | Procurement/finance | Approve or dispute bill |
| Usage attribution | Platform owner | Reassign unexplained/shared cost |
| Workflow conversion | Process owner | Fix triggers, retries, or case mix |
| Acceptance and review | Domain owner | Adjust scope, rubric, or controls |
| Forecast update | Finance + role owner | Resize plan or budget |
| Anomaly review | Security/operations | Investigate loops or misuse |
Preserve the original quote model. Update a new forecast column rather than overwriting assumptions, so later reviewers can see what changed.
§ 09Which Pricing Model Is Most Predictable?
The most predictable model is the one whose meter maps cleanly to stable demand, whose failure paths are observable, and whose commercial limits are enforceable.
Score 6 dimensions:
| Dimension | 1: weak | 3: adequate | 5: strong |
|---|---|---|---|
| Meter clarity | Ambiguous billable event | Documented with some edge cases | Complete examples and audit trail |
| Workload mapping | No reliable conversion | Pilot estimate | Stable measured conversion |
| Variance | Small process change causes large spend | Moderate sensitivity | Spend moves proportionally |
| Control | No cap or alert | Alerts only | Role cap, approval, and hard/soft limits |
| Reconciliation | Invoice total only | Aggregate usage | Item/role-level usage export |
| Contract flexibility | Long lock-in and no adjustment | Periodic true-up | Rightsizing and exit options |
Predictability score = sum of 6 dimensions ÷ 30 × 100
A fixed subscription may score poorly if required usage is unknown. A variable action model may score well if action counts are stable, tagged by role, and capped.
Test 5 adverse scenarios
- Volume spike: eligible work rises 50%.
- Quality drop: first-pass acceptance falls from 85% to 65%.
- Retry loop: runs per item rise from 1.1 to 2.2.
- Case-mix shift: high-complexity work doubles.
- Noisy trigger: scheduled or event-driven activity runs 5 times more often.
For each scenario, record invoice cost, full cost, accepted outcomes, and the control that detects or stops the change.
Distinguish cost continuity from service continuity
A hard usage stop protects the budget but may interrupt customer, operations, or compliance work. Automatic overage protects service but may expose spend.
Decide:
- which roles can stop;
- which may degrade to a lower-cost mode;
- which must queue;
- which require approval for overage;
- which transfer to a person; and
- which have a protected reserve.
Budget policy is an operating policy.
Use a role-level cost dashboard
The dashboard should connect commercial meters with useful work:
| Dashboard metric | Formula | Why it matters |
|---|---|---|
| Vendor cost | Attributed invoice amount | Controls billed spend |
| Full role cost | Vendor + human + operations + risk | Prevents invoice-only decisions |
| Units per eligible item | Billable units / eligible items | Detects workflow expansion |
| Units per accepted outcome | Billable units / accepted outcomes | Connects meter to quality |
| First-pass acceptance | Accepted without correction / reviewed | Detects weak output |
| Retry rate | Repeat runs / initial runs | Detects failure-driven usage |
| Unused-capacity rate | Expired/unused units / purchased units | Detects overcommitment |
| Forecast variance | Actual full cost - budget full cost | Supports monthly control |
| Worst incident severity | Highest severity in period | Keeps tail risk visible |
Segment these metrics by role and task subtype. A blended organization average can hide one role whose long context, tools, retries, or review burden consumes disproportionate capacity.
Set thresholds before launch. For example, investigate if units per accepted outcome rise 15% week over week, pause expansion if full cost exceeds the high case, and require approval before an autonomous role crosses its monthly reserve. The percentages are examples; choose limits from observed variance and operational consequence.
§ 10What Should Procurement Ask About AI Employee Pricing?
The AI employee platform RFP checklist should request proof, not a sales explanation.
Meter and invoice
- Define every billable unit.
- Provide the complete current rate card and multiplier table.
- Show 5 representative invoice traces from trigger to charge.
- Identify rounding, minimum, commitment, and overage.
- State which failed, retried, test, sandbox, and support activities are billed.
- Show how usage is attributed to role, workspace, user, model, tool, and environment.
- Provide a machine-readable export or API.
Capacity and controls
- Show current balance and forecast.
- Demonstrate alerts at 50%, 75%, 90%, and 100%.
- Demonstrate role-level budgets.
- Explain behavior at exhaustion.
- Identify who can enable overage or change limits.
- Explain pooled-capacity priority and reserve.
- Show anomaly detection for loops or spikes.
Contract
- State renewal, price-change, and notice terms.
- Explain unused units, rollover, expiry, and refunds.
- Show true-up timing.
- Identify minimum seats and usage.
- Explain plan changes during the term.
- State data export, deletion, transition, and termination rights.
- Price support, onboarding, integration, and premium controls.
Acceptance and quality
- Define vendor outcomes separately from buyer acceptance.
- Provide dispute and correction rules.
- Explain whether human handoff is billable.
- Identify service credits and exclusions.
- Provide uptime and support commitments when relevant.
Keep a quote-comparison table:
| Question | Vendor A | Vendor B | Vendor C | Evidence |
|---|---|---|---|---|
| Fixed monthly cost | Order form | |||
| Billing units | Rate card | |||
| Normal workload cost | Calculator | |||
| High workload cost | Calculator | |||
| Low-acceptance cost | Pilot | |||
| Full cost/accepted outcome | Buyer model | |||
| Limit behavior | Demo + contract | |||
| Export granularity | Sample file |
Use the broader 12-point platform evaluation for capability, persistence, triggers, tools, permissions, logs, handoffs, data posture, and operational fit. Cheap capacity is not useful if the platform cannot support the role safely.
§ 11How Should Buyers Evaluate CellCog’s Credit Pricing?
CellCog’s public pricing page describes monthly credit bundles, additional credits, credit validity, storage, modes, and other plan features. Prices and terms can change, so verify the selected plan and checkout terms on the purchase date.
Do not preserve a price from this article in a long-lived budget. Preserve the evaluation method.
Record the live quote
| Field | Buyer record |
|---|---|
| Verification date and timezone | |
| Selected plan/variant | |
| Billing period | Monthly or annual |
| Plan price | Live amount |
| Included credits | Live amount |
| Credit validity/rollover | Live term |
| Additional-credit rate | Live rate |
| Storage and feature limits | Live terms |
| Refund/cancellation terms | Live terms |
| Taxes/currency | Checkout |
Measure the role conversion
During a controlled AI employee pilot, record:
- eligible tasks;
- completed runs;
- modes used;
- tool and media activity;
- total credits;
- credits by task subtype;
- retries;
- accepted outcomes;
- review minutes;
- correction minutes; and
- idle or duplicate activity.
Calculate:
Credits per covered item = role credits ÷ covered items
Credits per accepted outcome = role credits ÷ accepted outcomes
Effective vendor cost per accepted outcome = attributed invoice cost ÷ accepted outcomes
Then add setup, integration, review, correction, monitoring, and failure exposure.
Define a CellCog budget gate
An illustrative gate might require:
- at least 100 representative items;
- first-pass acceptance of at least 80%;
- no unacceptable high-severity event;
- median review below 5 minutes;
- credits per accepted outcome within a stated band;
- no unexplained usage spike above 20%;
- normal and high cases inside budget; and
- an identified plan for unused or excess credits.
Those numbers are examples, not CellCog performance promises. Set the actual gate from the role, baseline, value, and risk tolerance.
Normalize one real role before choosing a plan: same workload, same accepted outcome, same review policy, and the same downside cases. The most useful pricing model is the one the operating team can explain, reconcile, and control.
Q1Which AI employee pricing model is cheapest?
No model is always cheapest. Cost depends on the workload, runs and actions per case, acceptance, retries, required users, commitment, and operating effort. Normalize every quote to full cost per accepted outcome under the same scenarios.
Q2Are credits the same as tokens?
Not necessarily. Tokens usually measure model input or output. Credits are a vendor-defined commercial unit that may represent tokens, modes, actions, tools, media, compute, or a combination. Request the current conversion and multiplier table.
Q3Is outcome-based pricing always better for buyers?
No. It can align payment with a vendor-defined result, but that result may differ from your acceptance rule. Minimum commitments, human review, corrections, customer impact, and other costs can remain even when a failed vendor outcome is unbilled.
Q4How do I compare seat pricing with usage pricing?
Calculate the required seats and all usage under the same monthly role. Add included-capacity utilization, overage, add-ons, and internal operating cost, then divide total cost by accepted outcomes.
Q5What makes AI employee pricing unpredictable?
Unclear meters, variable case complexity, retries, tool-call loops, event spikes, shared credit pools, model multipliers, low acceptance, minimum commitments, and automatic overage create variance. Usage attribution, alerts, budgets, limits, and scenario testing improve control.
Q6How often should pricing assumptions be updated?
Verify public prices at purchase, renewal, and any material plan or workload change. Update workload conversion monthly during a pilot and on a regular operating cadence after deployment. Preserve the dated rate card and invoice evidence used for each decision.