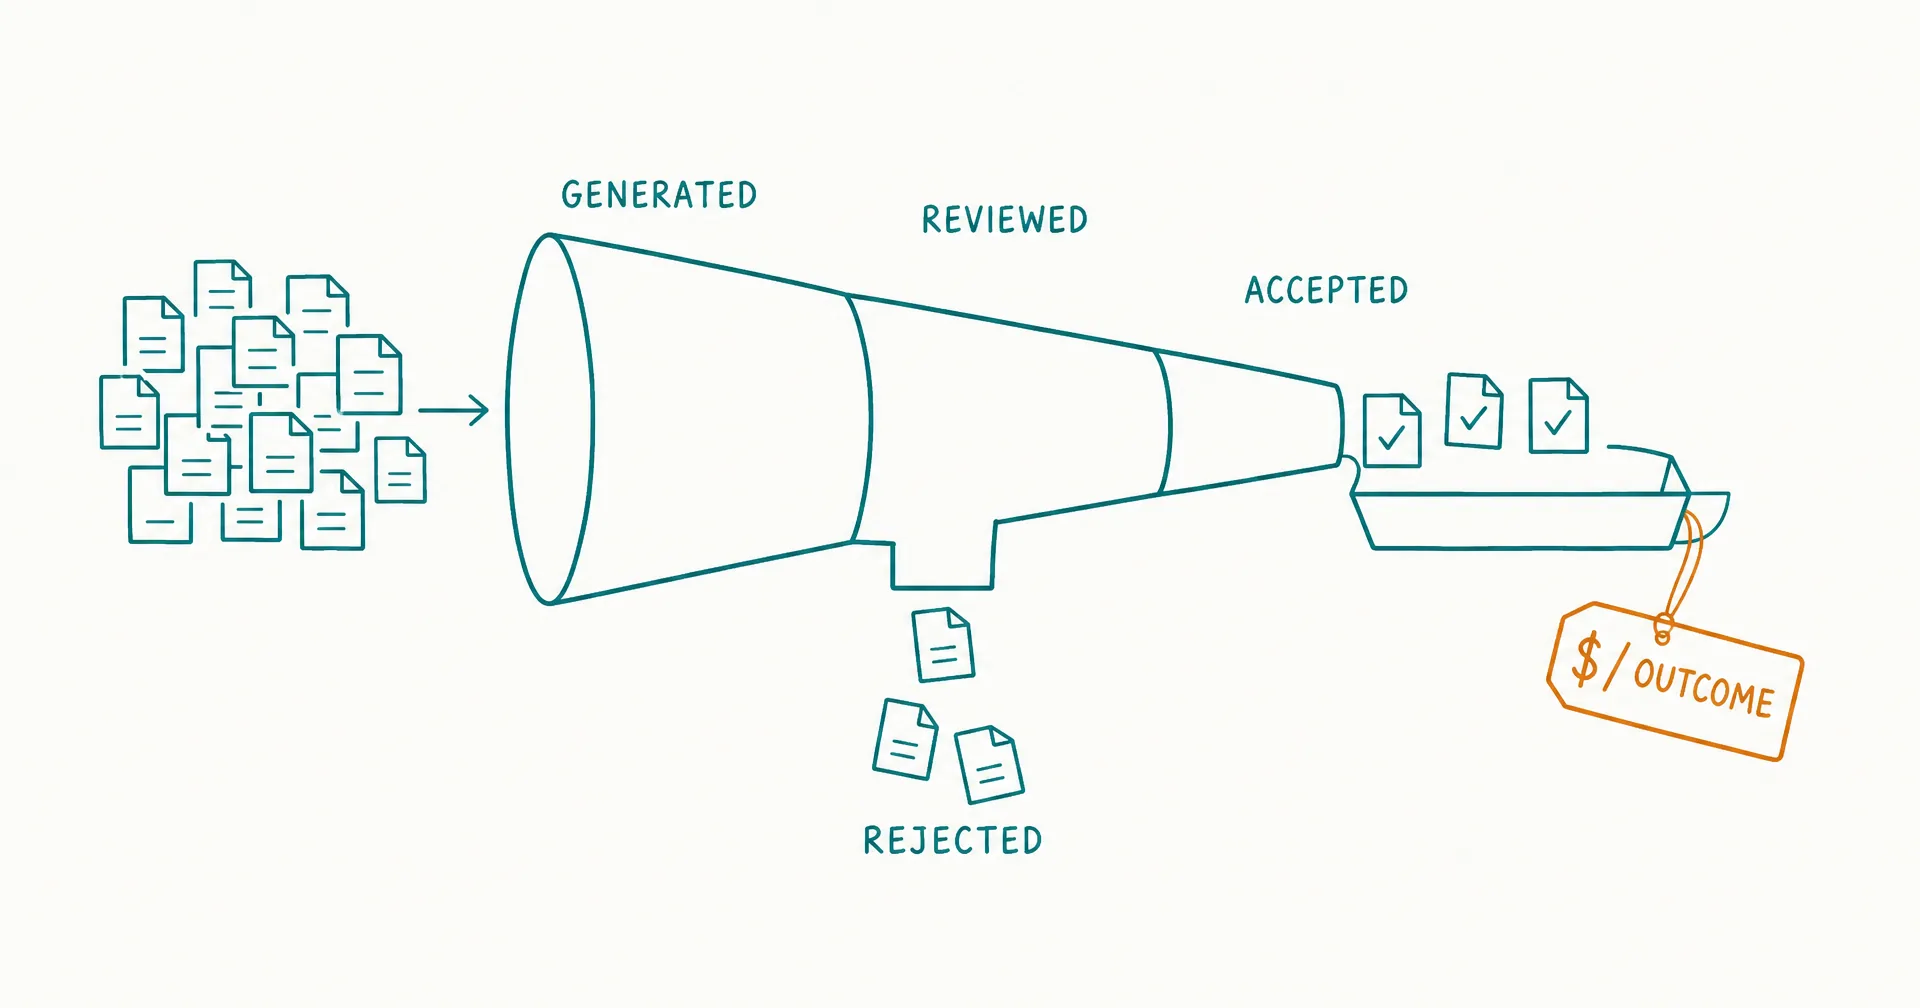
AI employee pricing tells you what a vendor bills. Cost per outcome tells you what the business receives for everything it spends.
The difference matters because a low-cost run can produce unusable work. A more expensive run can produce an accepted result without correction. One workflow can create 1 answer, 4 tool calls, 2 retries, and 45 minutes of review. Another can stop safely and route the case to a person. The invoice sees billable units; the business sees accepted work, delay, labor, and risk.
The most useful unit-economic measure is:
Cost per accepted outcome = full cost of the measured workflow ÷ accepted outcomes
“Full cost” includes more than vendor usage. “Accepted outcome” means more than generated output. Both terms need written definitions, traceable data, and a fixed measurement period.
This guide builds that metric from the ground up. It shows how to classify outcomes, allocate cost, handle review and correction, compare pricing models, segment difficult work, and prevent an attractive average from hiding weak quality or unsafe failures.
On this page · 11 sectionsOpen
- What Is AI Employee Cost per Accepted Outcome?
- What Counts as an Accepted Outcome?
- What Costs Belong in the Numerator?
- What Belongs in the Denominator?
- How Do You Calculate Cost per Accepted Outcome?
- What Does a Worked Cost-per-Outcome Model Look Like?
- How Do You Compare Credits, Seats, Tasks, and Outcome Pricing?
- Why Must You Segment Cost per Outcome?
- How Do Quality, Severity, and Business Value Change the Metric?
- What Dashboard and Review Cadence Should You Use?
- How Do You Pilot and Improve the Metric?
- Cost per accepted outcome connects AI spending with useful business work; cost per token, credit, run, or generated item does not.
- Define the outcome and acceptance rule before collecting cost data. The rule should be the same for AI-produced, human-produced, and hybrid work.
- Include platform and usage charges, setup amortization, integrations, review, correction, monitoring, and expected failure cost in the numerator.
- Count only outcomes that satisfy the acceptance contract in the denominator. Track first-pass acceptance, corrected acceptance, safe escalation, rejection, reopening, and incidents separately.
- Do not hide human labor. Review and correction minutes often determine whether an inexpensive AI workflow is economically useful.
- Segment the metric by case type, workflow version, model, channel, customer group, and risk level. A blended average can hide an unprofitable or unsafe cohort.
- Use cost per accepted outcome with quality, cycle time, coverage, and severity measures. No single average is sufficient for a production decision.
§ 01What Is AI Employee Cost per Accepted Outcome?
AI employee cost per accepted outcome is the total cost required to produce one result that satisfies a predefined business acceptance rule.
It is a business unit metric, not merely a technical efficiency metric.
| Metric | Numerator | Denominator | What it answers |
|---|---|---|---|
| Cost per token | Model spend | Tokens | How expensive is model consumption? |
| Cost per run | Run-attributed spend | Runs | How expensive is one execution? |
| Cost per generated item | Workflow spend | Generated items | How expensive is production volume? |
| Cost per completed item | Workflow spend | Technically completed items | How expensive is technical completion? |
| Cost per accepted outcome | Full workflow cost | Outcomes meeting the acceptance rule | How expensive is useful work? |
| Cost per valuable outcome | Full workflow cost | Accepted outcomes weighted by business value | How does cost relate to differentiated value? |
Technical measures still matter. They help engineers understand why cost changes. They are weak final denominators because the organization does not buy tokens, actions, or agent turns for their own sake.
The FinOps Foundation’s current Unit Economics capability makes this distinction explicit: resource-efficiency measures and business-unit measures should be defined, related, and tied to organizational goals. For an AI employee, that relationship can be written as a metric tree:
Technical consumption → workflow activity → completed work → accepted outcome → business value
Start with a bounded outcome
An outcome should be small enough to count consistently and meaningful enough to matter.
| Weak denominator | Better accepted-outcome definition |
|---|---|
| Emails written | Approved email delivered to the correct recipient under the outreach policy |
| Tickets touched | Eligible support case resolved without a policy breach or reopen during the defined window |
| Reports generated | Complete report with reconciled inputs, cited evidence, and owner approval |
| Leads researched | Account record meeting required fit, contact, source, and exclusion fields |
| Records processed | Eligible record updated correctly with evidence and no unresolved exception |
| Meetings summarized | Decision and action record accepted by the meeting owner |
The denominator should reflect the value boundary of the role. If a role only drafts a report, the accepted outcome may be an approved draft. If the role owns extraction through delivery, a draft is an intermediate artifact, not the outcome.
The AI employee total-cost framework explains the numerator in detail. Cost per accepted outcome combines that cost view with a controlled measure of accepted work.
Keep the metric’s scope visible
Every reported figure should carry 5 labels:
- workflow or role;
- outcome definition;
- measured population;
- time period; and
- cost boundary.
“$11.15 per accepted evidence packet for eligible standard and incomplete-input cases in June, using fully loaded run cost” is interpretable.
“Our AI costs $2 per task” is not.
§ 02What Counts as an Accepted Outcome?
An accepted outcome meets a written contract that can be applied consistently by a reviewer, a downstream system, or a validated automated check.
The contract should specify:
- eligible input;
- required fields or components;
- correctness and completeness thresholds;
- evidence or source requirements;
- policy constraints;
- permitted actions;
- service-level window;
- escalation rules;
- reopen or observation window; and
- final owner.
Use an acceptance contract
| Contract field | Example for an evidence-packet workflow |
|---|---|
| Eligible item | Case has an ID, approved source set, and required consent state |
| Required output | Summary, 8 structured fields, evidence links, exception code |
| Accuracy | Every factual field supported by the linked source |
| Completeness | All required fields populated or explicitly marked unavailable |
| Policy | No unapproved source or external action |
| Timeliness | Ready for review within 4 business hours |
| Escalation | Conflicting evidence, missing authority, or high-impact case routed |
| Acceptance authority | Named operations reviewer |
| Reopen window | 7 calendar days |
| Version | Contract v1.2, effective date recorded |
Do not change the acceptance rule after seeing the result. That turns measurement into storytelling.
If the standard changes, version it and report the cohorts separately. A workflow operating under a stricter contract may have a lower acceptance rate even though its business usefulness has improved.
Separate the outcome states
Use mutually exclusive final states for every eligible item:
| Final state | Meaning | Count in accepted-output denominator? |
|---|---|---|
| Accepted first pass | Meets the contract without correction | Yes |
| Accepted after correction | Meets the contract after recorded human or system correction | Yes, with correction cost |
| Correctly escalated | Stops and routes according to the contract | Separate controlled-outcome measure |
| Rejected | Does not meet the contract | No |
| Abandoned | Work started but no valid final state was produced | No |
| Ineligible | Never belonged in the measured population | Exclude from eligible volume |
| Reopened | Previously accepted but failed within the observation window | Reverse or restate according to policy |
| Incident | Causes a defined policy, security, financial, or customer-impact event | No; record severity separately |
Correct escalation deserves special treatment.
In a bounded AI role, stopping can be the right behavior. However, an escalation is not automatically equivalent to a completed business deliverable. Report:
Cost per accepted deliverable = full cost ÷ accepted deliverables
and, where useful:
Cost per controlled disposition = full cost ÷ (accepted deliverables + correct escalations)
Never combine the two without naming the broader denominator. Otherwise, a workflow can improve its reported “success” simply by escalating most cases.
Count correction honestly
An item accepted after 20 minutes of correction can belong in the accepted denominator if the contract permits corrected acceptance. Its correction time must stay in the numerator, and the first-pass rate must remain visible.
This yields three useful views:
First-pass acceptance rate = first-pass accepted ÷ completed items
Final acceptance rate = all accepted outcomes ÷ completed items
Correction dependence = corrected accepted ÷ all accepted outcomes
The combination distinguishes a reliable producer from a draft generator supported by hidden human labor.
The human-in-the-loop operating guide can help define where review, approval, correction, and escalation belong before the pilot starts.
§ 03What Costs Belong in the Numerator?
The numerator should reflect the economic decision being made.
For a short pilot, use incremental run cost and separately disclose one-time setup. For a production business case, use a fully loaded cost boundary. For vendor comparison, apply the same boundary to every option.
Build the full-cost ledger
| Cost layer | Typical items | Allocation method |
|---|---|---|
| Platform access | Subscription, workspace, seats, enterprise minimum | Direct charge or allocated share |
| Variable usage | Credits, tokens, runs, actions, conversations, outcomes | Tagged or metered usage |
| Models and tools | External model APIs, search, data, enrichment, messaging | Direct usage by workflow |
| Infrastructure | Compute, storage, database, vector store, network | Tagged cost or defensible allocation |
| Setup | Design, configuration, evaluation, migration, training | Amortize over chosen horizon |
| Integration | Connector build, testing, maintenance | Direct cost plus amortized build |
| Review | Human time to inspect or approve | Minutes x loaded hourly rate |
| Correction | Human or system remediation | Minutes and additional usage |
| Operations | Monitoring, support, governance, incident readiness | Role-attributed share |
| Failure | Rework, credits, delay, lost value, incident exposure | Observed or expected cost |
| Capacity waste | Unused commitment, idle resources, expired credits | Allocate to the workload causing commitment |
| Change | Regression tests, prompt/model updates, retraining | Period expense or amortization |
Use:
Full workflow cost = direct technology + allocated fixed cost + amortized setup + human review + correction + operations + expected failure cost
The exact ledger will vary, but the inclusion rule should not vary between vendors.
Convert time into economic cost
Human minutes are not free because the reviewer is salaried.
Review cost = review hours × loaded reviewer hourly cost
Correction cost = correction hours × loaded corrector hourly cost + incremental rerun cost
Use a finance-approved loaded hourly rate or a documented capacity-cost assumption. If review replaces other work rather than creating a cash payment, show 2 views:
- cash cost, which includes incremental cash expenditure; and
- economic cost, which includes the value of scarce internal capacity used.
This distinction is particularly important during a pilot. The invoice may be small because a manager is donating 8 hours each week to inspection.
Allocate shared cost deliberately
Shared platform and operations costs require a rule.
| Allocation base | Best use | Main limitation |
|---|---|---|
| Direct metered usage | Variable model, tool, or compute cost | Misses fixed access and shared support |
| Active workflows | Similar roles with comparable demand | Treats unequal workloads as equal |
| Eligible volume | Cost caused broadly by case volume | Can penalize low-complexity cohorts |
| Run time or actions | Workloads with measurable execution intensity | May reward inefficient execution |
| Accepted outcomes | Business-unit view | Can burden low-acceptance pilots heavily |
| Capacity reservation | Committed infrastructure or credit pools | Requires ownership of unused capacity |
| Named users | Seat-dominated tools | Weak for autonomous activity |
State the rule beside the metric. Test a second reasonable rule as a sensitivity case. If the vendor ranking changes only because of allocation choice, the economic conclusion is not robust.
Include the cost of failure
For recurring, measurable failure categories:
Expected failure cost = probability of failure × cost if failure occurs
Possible components include:
- human investigation and rework;
- customer credit or recovery;
- delayed revenue or service;
- duplicate purchase or action;
- notification and incident handling;
- data restoration;
- contractual consequence; and
- estimated exposure for rare severe events.
Do not force a speculative dollar value onto every reputational, legal, or safety risk. Keep severe or hard-to-price risks in a separate severity register and decision threshold. An average cost metric must not make an unacceptable tail risk look affordable.
The AI employee ROI model shows how to keep payback, review demand, and risk-adjusted benefit in the same decision model.
§ 04What Belongs in the Denominator?
The denominator begins with the eligible population and ends with accepted outcomes.
Use a population waterfall:
Received → eligible → attempted → technically completed → reviewed → accepted first pass → accepted after correction → retained after observation window
Every subtraction needs a reason code.
Build a volume reconciliation
| Population stage | Count | Reconciliation question |
|---|---|---|
| Received | 1,080 | Did all incoming items receive an ID? |
| Ineligible | 80 | Do exclusion codes match the scope contract? |
| Eligible | 1,000 | Does received minus ineligible equal eligible? |
| Not attempted | 100 | Was capacity, routing, or access the cause? |
| Attempted | 900 | Does eligible minus not attempted equal attempted? |
| Failed or abandoned | 60 | Is every failure classified? |
| Technically completed | 840 | Does attempted reconcile to completion states? |
| Rejected after review | 60 | Are rejection reasons recorded? |
| Accepted after correction | 80 | Are correction minutes and reruns captured? |
| Accepted first pass | 700 | Did each item pass the same contract? |
| Accepted outcomes | 780 | First pass plus corrected accepted |
This ledger prevents denominator leakage.
Common leakage patterns include:
- counting technically completed items as accepted;
- excluding expensive failures from the cost period;
- counting only reviewed samples while applying the rate to all output;
- dropping items with missing logs;
- counting one business case several times because it produced several artifacts;
- retaining reopened items as accepted;
- mixing correct escalation with completed work; and
- comparing unlike acceptance windows.
Use stable identifiers
Give each eligible case a durable ID. Link that ID across:
- source intake;
- task or run;
- model and workflow version;
- tool calls;
- reviewer decision;
- correction event;
- final outcome state;
- escalation;
- incident; and
- cost allocation.
A task-board model for AI employees is useful because it preserves queue state and ownership. The economic ledger should join to those same work identifiers instead of estimating output from invoice totals alone.
Decide how to handle delayed outcomes
Some work is accepted immediately; other work needs an observation window.
Examples:
- a support resolution may reopen;
- a lead may be rejected by sales after handoff;
- a report may fail reconciliation during the next close;
- a content asset may be rejected at final approval; or
- a record update may be reversed by a downstream validation.
Choose one policy:
- cohort policy: assign later reversals to the month in which the work originated; or
- period policy: record reversals when discovered and show restatements.
Cohort reporting is usually clearer for workflow evaluation. Financial reporting may require a different treatment. Whatever the choice, use it consistently.
§ 05How Do You Calculate Cost per Accepted Outcome?
Start with 4 core equations.
Accepted outcomes = first-pass accepted + corrected accepted - reopened outcomes under the selected policy
Full cost = technology + setup allocation + integration + review + correction + operations + expected failure cost
Cost per accepted outcome = full cost ÷ accepted outcomes
Marginal cost per additional accepted outcome = change in cost ÷ change in accepted outcomes
The average and marginal views answer different questions. Average cost supports the overall business case. Marginal cost helps decide whether to expand volume, add a case type, or change a review policy.
Keep companion measures next to cost
| Measure | Formula | Decision signal |
|---|---|---|
| Coverage | Attempted eligible items / eligible items | How much work enters the workflow? |
| Completion | Technically completed / attempted | Does execution finish? |
| First-pass acceptance | First-pass accepted / reviewed completed items | How often is correction unnecessary? |
| Final acceptance | All accepted / reviewed completed items | How much work becomes usable? |
| Correction dependence | Corrected accepted / all accepted | How much value depends on rework? |
| Safe escalation | Correct escalations / items requiring escalation | Does the role stop correctly? |
| Review minutes/outcome | Review minutes / accepted outcomes | How much oversight is required? |
| Correction minutes/outcome | Correction minutes / accepted outcomes | How much remediation is required? |
| Cost/accepted outcome | Full cost / accepted outcomes | What does useful work cost? |
| Cycle time | Accepted timestamp - eligible timestamp | How quickly does value arrive? |
One workflow can improve cost per accepted outcome by cutting review while worsening a severe-error rate. The companion measures make that tradeoff visible.
Calculate from reconciled data, not a rounded dashboard
At minimum, retain:
- raw cost by category;
- raw counts by final state;
- labor minutes and rate;
- time window;
- outcome-contract version;
- workflow/model version;
- allocation method; and
- calculation version.
The AI employee audit-log guide explains how execution evidence supports review and incident reconstruction. The cost ledger does not replace the audit log; it joins economic information to it.
§ 06What Does a Worked Cost-per-Outcome Model Look Like?
Consider a fictional monthly evidence-packet workflow. All figures below are illustrative and are not CellCog pricing, a vendor quote, or a performance claim.
The role receives 1,080 items. Eighty are ineligible, leaving 1,000 eligible cases. It attempts 900 and produces 840 technically completed packets. Review accepts 700 on the first pass, accepts 80 after correction, and rejects 60.
Monthly cost ledger
| Cost category | Monthly amount |
|---|---|
| Platform and variable usage | $2,100 |
| Setup amortization | $700 |
| Integration and data services | $300 |
| Review: 60 hours x $55 | $3,300 |
| Correction: 25 hours x $55 | $1,375 |
| Monitoring and operations | $500 |
| Expected failure cost | $425 |
| Full monthly cost | $8,700 |
The primary calculation is:
$8,700 ÷ 780 accepted outcomes = $11.15 per accepted outcome
Now compare misleading alternatives:
| Reported calculation | Result | Why it differs |
|---|---|---|
| Vendor charge / accepted outcomes | $2,100 / 780 = $2.69 | Excludes setup, labor, operations, and failure |
| Full cost / attempted items | $8,700 / 900 = $9.67 | Counts attempts instead of useful results |
| Full cost / technically completed | $8,700 / 840 = $10.36 | Counts rejected packets |
| Full cost / accepted outcomes | $8,700 / 780 = $11.15 | Uses full cost and accepted work |
The $2.69 figure is not mathematically wrong. It is the vendor cost per accepted outcome. It becomes misleading when presented as the workflow’s total unit cost.
Read the operating signals
The same example produces:
Coverage = 900 ÷ 1,000 = 90%
Completion rate = 840 ÷ 900 = 93.3%
First-pass acceptance = 700 ÷ 840 = 83.3%
Final acceptance = 780 ÷ 840 = 92.9%
Correction dependence = 80 ÷ 780 = 10.3%
Review minutes per accepted outcome = 3,600 ÷ 780 = 4.62 minutes
Correction minutes per accepted outcome = 1,500 ÷ 780 = 1.92 minutes
These measures tell the story behind $11.15. The workflow has strong final acceptance, but human labor accounts for more than half of full cost. The next optimization question should therefore include review design, sampling, input quality, and first-pass reliability - not only model price.
Model a credible improvement
Suppose better input validation and a narrower review policy produce:
- the same 780 accepted outcomes;
- review falls from 60 to 44 hours;
- correction falls from 25 to 18 hours;
- technology cost rises by $250;
- monitoring cost stays constant; and
- expected failure cost falls by $100.
New full cost:
$2,350 + $700 + $300 + (44 × $55) + (18 × $55) + $500 + $325 = $7,585
New cost per accepted outcome:
$7,585 ÷ 780 = $9.72
The workflow spends more on technology but reduces total unit cost by $1.43 because it consumes less human effort and carries lower expected failure cost.
That is the kind of tradeoff cost per accepted outcome is designed to reveal.
§ 07How Do You Compare Credits, Seats, Tasks, and Outcome Pricing?
Convert every commercial model into the same workload and acceptance contract.
The AI employee pricing-model guide explains how subscriptions, seats, credits, tokens, runs, actions, conversations, and outcomes create different invoice behavior. Cost per accepted outcome is the normalization layer above those meters.
Normalize each quote
| Pricing basis | Forecast step | Unit-economic correction |
|---|---|---|
| Subscription | Fixed fee plus included capacity and overage | Allocate unused capacity and add operating cost |
| Seat | Paid seat types x rate | Add usage; divide by accepted outcomes, not users |
| Credit/token | Consumption x effective unit rate | Include retries, tools, fallback, and acceptance rate |
| Task/run | Billable executions x rate | Map multiple runs to one business case |
| Action/message | Events per case x volume x rate | Include loops and event storms |
| Conversation | Sessions under contract boundary x rate | Test reopen and multi-session behavior |
| Outcome | Billable vendor outcome x rate | Reconcile vendor outcome with buyer acceptance |
| Commitment | Minimum spend or capacity | Include unused amount and overage exposure |
For each option:
- forecast eligible volume by cohort;
- map cases to billable units;
- apply normal, heavy, and failure scenarios;
- calculate vendor cost;
- add the same non-vendor cost layers;
- forecast accepted outcomes under the same contract; and
- calculate full cost per accepted outcome.
Test the billable-to-business conversion
Use:
Billable units per accepted outcome = total billable units ÷ accepted outcomes
Vendor cost per accepted outcome = vendor cost ÷ accepted outcomes
Full cost per accepted outcome = full workflow cost ÷ accepted outcomes
A vendor that charges $0.20 per run but needs 8 runs per accepted outcome starts at $1.60 before human and operating costs. A vendor that charges $1.20 per outcome may be less expensive if its outcome matches the buyer’s acceptance rule and does not create extra correction.
Compare variance as well as average
| Scenario | What changes | Economic question |
|---|---|---|
| Normal | Expected volume and quality | What is the base unit cost? |
| High volume | More eligible cases | Does fixed cost dilute or overage dominate? |
| Low acceptance | More rejected output | How sharply does unit cost rise? |
| Retry-heavy | More runs/actions per case | Does technical instability create spend? |
| Event storm | Duplicate or recursive triggers | Can spend controls stop runaway cost? |
| Reviewer shortage | Longer queues or higher labor rate | Does the workflow still produce timely value? |
| Model change | Different price and quality | Does lower usage cost survive acceptance testing? |
| Commitment underuse | Lower actual demand | What is the cost of unused capacity? |
AWS’s current agentic AI cost-optimization guidance highlights retries, fallback chains, tool-call sprawl, event volume, model choice, and observability as cost drivers. Google Cloud’s AI and ML cost-optimization guidance similarly recommends connecting resource costs with business goals and measuring actual costs and returns over time.
The commercial meter determines how those behaviors reach the invoice. The acceptance rate determines whether the spend produces useful work.
§ 08Why Must You Segment Cost per Outcome?
A blended average can be numerically correct and operationally useless.
Suppose the overall workflow reports $11.15 per accepted outcome. The standard cohort may cost $6, while the high-ambiguity cohort costs $39 and creates most severe errors. Expanding the average hides the marginal economics of the cases being added.
Segment by decision-relevant cohorts
| Segmentation | Example | What it can reveal |
|---|---|---|
| Case difficulty | Standard, incomplete, conflicting, novel | Where retries and correction accumulate |
| Risk | Low, moderate, high impact | Where approval and failure exposure rise |
| Channel | Email, chat, web, internal system | Differences in input quality and action cost |
| Customer/account | Tier, region, contract type | Service and policy variation |
| Workflow version | v1.3 vs v1.4 | Whether a change improved economics |
| Model route | Small, large, fallback | Whether expensive routing creates accepted value |
| Reviewer | Team or skill level | Calibration and review-time differences |
| Time | Week, month, season | Volume, learning, and drift |
| Outcome type | Deliverable, resolution, qualification | Different value and acceptance contracts |
Every segment needs enough volume to interpret. Do not present a noisy 5-case cohort as a stable benchmark.
Use cohort reconciliation
For every segment, report:
- eligible items;
- attempted items;
- accepted first pass;
- accepted after correction;
- correct escalations;
- rejected and reopened items;
- full cost;
- cost per accepted outcome;
- review and correction minutes;
- cycle time; and
- incidents by severity.
The segment totals should reconcile to the overall population and cost ledger.
Distinguish average from marginal economics
An existing platform fee can make the next 100 standard cases inexpensive. Adding a new high-risk cohort can require a specialist reviewer, premium model, new data source, and approval layer.
Use:
Marginal cost of cohort = cost with cohort - cost without cohort
Marginal accepted outcomes = accepted outcomes with cohort - accepted outcomes without cohort
Marginal cost per accepted outcome = marginal cost ÷ marginal accepted outcomes
Do not use the blended historic average to approve a materially different scope.
§ 09How Do Quality, Severity, and Business Value Change the Metric?
Cost per accepted outcome is necessary, but it is not sufficient.
An acceptance contract can still miss a defect. A low average can coexist with rare severe harm. Accepted outcomes can also have different values.
Add a quality and consequence guardrail
| Dimension | Example measure | Decision rule |
|---|---|---|
| Correctness | Defect rate after acceptance | Must remain below threshold |
| Completeness | Required-field pass rate | Must meet contract |
| Evidence | Traceable-source rate | Must meet role requirement |
| Policy | Policy-breach rate | Zero or strict threshold |
| Escalation | Missed mandatory escalation | Zero for defined high-risk classes |
| Reopen | Reopen rate within window | Must not worsen beyond limit |
| Severity | Incidents by level | Any severe incident triggers review |
| Human burden | Review/correction minutes | Must fit available capacity |
| Timeliness | Service-level attainment | Must meet service commitment |
Do not divide severe incidents into dollars and declare them acceptable merely because the average remains low. Some controls are constraints, not economic tradeoffs.
The National Institute of Standards and Technology’s AI Risk Management Framework resources emphasize measuring systems in context, documenting limits, tracking performance, and evaluating risk over time. That operating discipline fits cost-per-outcome measurement: quality and risk evidence must travel with the cost figure.
Add value only when it is defensible
If accepted outcomes differ materially in value, report cost by outcome class before creating a weighted metric.
One optional form is:
Value-adjusted outcome units = sum of (accepted outcomes in class x approved value weight)
Cost per value-adjusted outcome = full cost ÷ value-adjusted outcome units
Weights should come from an agreed business model, not from the team trying to justify the AI system.
For example:
| Outcome class | Accepted count | Approved weight | Weighted units |
|---|---|---|---|
| Standard evidence packet | 600 | 1.0 | 600 |
| Complex evidence packet | 150 | 1.8 | 270 |
| Priority evidence packet | 30 | 2.5 | 75 |
| Total | 780 | 945 |
If full cost is $8,700:
$8,700 ÷ 945 = $9.21 per value-adjusted outcome unit
Keep the unweighted $11.15 figure beside it. Weighted metrics are helpful for portfolio choices but easier to manipulate.
Compare against the real alternative
The AI employee versus human cost comparison applies the same outcome contract across an existing team, a new employee, a contractor or service, deterministic automation, and an AI-assisted operating model.
The comparison should include:
- full cost per accepted outcome;
- coverage;
- first-pass acceptance;
- review and correction demand;
- cycle time;
- capability boundary;
- incident severity;
- ramp time; and
- flexibility.
The winning option is not necessarily the lowest average. It is the feasible operating model that meets the required quality, authority, timing, and risk constraints at an acceptable cost.
§ 10What Dashboard and Review Cadence Should You Use?
The dashboard should connect money, work state, quality, and change history.
Minimum monthly dashboard
| Panel | Required fields |
|---|---|
| Scope | Workflow, owner, outcome contract, versions, measured period |
| Volume | Received, eligible, attempted, completed, accepted, escalated, rejected, reopened |
| Quality | First-pass and final acceptance, defects, evidence rate, severity |
| Human demand | Review hours, correction hours, exception hours, queue age |
| Technology cost | Platform, model, tool, infrastructure, overage |
| Full cost | Setup allocation, labor, operations, failure, total |
| Unit economics | Vendor and full cost per accepted outcome by cohort |
| Reliability | Retries, tool failures, latency, completion, recovery |
| Change | Prompt, model, policy, integration, reviewer, and contract changes |
| Action | Owner, decision, due date, expected effect, validation period |
The FinOps for AI tools and services guidance recommends visibility into cost by use case, model and token consumption, error and retry rates, and appropriate allocation. Cost per accepted outcome adds the business-result side of that view.
Use three review cadences
| Cadence | Participants | Primary decisions |
|---|---|---|
| Daily or per shift | Operator and role owner | Stop, reroute, handle incident, clear queue |
| Weekly | Product/operations, reviewer, engineering | Diagnose cohorts, retries, corrections, and drift |
| Monthly | Business owner, finance, risk, technical owner | Continue, expand, narrow, renegotiate, or retire |
Daily review protects operations. Weekly review improves the workflow. Monthly review tests whether the economic thesis still holds.
Treat change as a new measurement event
Record changes to:
- system instructions;
- model or model version;
- retrieval source;
- tool or connector;
- action permission;
- acceptance contract;
- reviewer pool;
- case scope;
- pricing;
- allocation rule; and
- incident policy.
If a material change occurs mid-period, segment before and after the change. Otherwise, the average combines different systems.
Set alerts on drivers, not just invoices
Alert on:
- cost per accepted outcome above threshold;
- acceptance or coverage below threshold;
- review or correction minutes above threshold;
- retries or tool calls per accepted outcome rising;
- unexpected model-route mix;
- unallocated spend;
- commitment utilization falling;
- severe or mandatory-escalation failure;
- missing outcome states; and
- reconciliation gaps.
Invoice alerts arrive after the behavior has already consumed money. Driver alerts can stop the failure earlier.
§ 11How Do You Pilot and Improve the Metric?
Begin with one bounded workflow and one month of reconciled evidence.
Four-week measurement plan
| Week | Work | Exit condition |
|---|---|---|
| 1: Contract | Define eligible population, acceptance, escalation, observation window, and owner | Reviewers can classify the same sample consistently |
| 2: Instrument | Connect case IDs, runs, costs, review, correction, and final states | Every pilot item can be reconciled |
| 3: Operate | Run normal work; review every item or an approved risk-based sample | No unresolved high-severity control issue |
| 4: Decide | Calculate cohorts, sensitivity, alternative comparison, and capacity effect | Owner records continue, change, narrow, or stop decision |
For a low-volume or high-risk workflow, the measurement period may need to be longer. The point is not the calendar; it is enough representative work to test the economic and control assumptions.
Pilot record
| Field | Required entry |
|---|---|
| Business outcome | One sentence |
| Acceptance contract | Version and effective date |
| Eligible population | Included and excluded cases |
| Case mix | Expected and observed cohorts |
| Cost boundary | Cash, economic, and fully loaded views |
| Human rate | Source and owner |
| Allocation rule | Base and sensitivity method |
| Baseline | Current operating model |
| Guardrails | Quality, severity, authority, and service thresholds |
| Decision | Continue, change, narrow, expand, or stop |
Improvement order
Use the cost tree to find the largest controllable driver:
- remove unnecessary work or ineligible cases;
- improve input quality and scope;
- reduce failed and abandoned executions;
- raise first-pass acceptance;
- reduce unnecessary review while preserving guardrails;
- reduce correction and reopen rates;
- simplify tool calls and retries;
- route work to the appropriate model or method;
- improve commitment utilization; and
- negotiate price after workload behavior is understood.
A unit-price discount does not fix poor acceptance. A cheaper model does not help if it creates more review. Removing a redundant run can reduce both cost and latency. Improving source quality can improve acceptance without changing the model.
Decision checklist
- Is the outcome valuable and bounded?
- Is the acceptance contract written and versioned?
- Does every eligible item reach one final state?
- Are corrected outcomes counted with their correction cost?
- Are correct escalations reported separately from deliverables?
- Are shared costs allocated consistently across alternatives?
- Are review minutes based on measured activity?
- Are retries, fallbacks, and tool fees included?
- Does the cost period align with the outcome cohort?
- Are quality, severity, coverage, and cycle time visible?
- Can the total be reconciled to invoices, logs, and time records?
- Does the workflow outperform a real alternative under the same standard?
If several answers are “no,” the cost-per-outcome figure is not ready for an investment decision.
CellCog plan terms and included usage can change. Verify the current CellCog pricing page, contract definitions, integrations, and workload assumptions on the decision date. Then track accepted-output rate and correction minutes for one month before treating any forecast as operating evidence.
Q1What is the difference between cost per task and cost per accepted outcome?
Cost per task divides cost by a task or workflow event. One business case can create several tasks, and a completed task can still produce rejected work. Cost per accepted outcome divides the full workflow cost by results that meet a predefined acceptance contract. Task cost is useful for technical diagnosis; accepted-outcome cost is more useful for business comparison.
Q2Should corrected output count as an accepted outcome?
It can, if the acceptance contract allows correction and the result ultimately meets the same standard. Record it as accepted after correction, include correction time and rerun cost in the numerator, and report correction dependence beside the final acceptance rate. Do not present corrected work as first-pass acceptance.
Q3Is a correct escalation an accepted outcome?
A correct escalation is a successful control behavior, but it may not be the business deliverable. Report cost per accepted deliverable and cost per controlled disposition separately. If escalation itself is the contracted outcome, define that explicitly before measurement.
Q4How should setup cost be handled?
Show setup as a separate one-time amount and amortize it over a documented useful period or expected outcome volume for the fully loaded view. Test a shorter horizon as a sensitivity case. Do not omit setup from one option while including it for another.
Q5Can cost per accepted outcome be used during a small pilot?
Yes, but label the result as pilot evidence and show cohort counts. Small samples can be distorted by unusual case mix, donated reviewer time, missing failure classes, or one-time setup. Use the pilot to validate the data model and identify cost drivers, not to claim a universal benchmark.
Q6What should be optimized first when the metric is too high?
Inspect the cost tree. The largest driver may be low acceptance, review time, correction, retries, tool calls, an expensive model route, unused commitment, or unnecessary work entering the queue. Improve the largest controllable cause while keeping quality and severity guardrails fixed; do not optimize the sticker price in isolation.