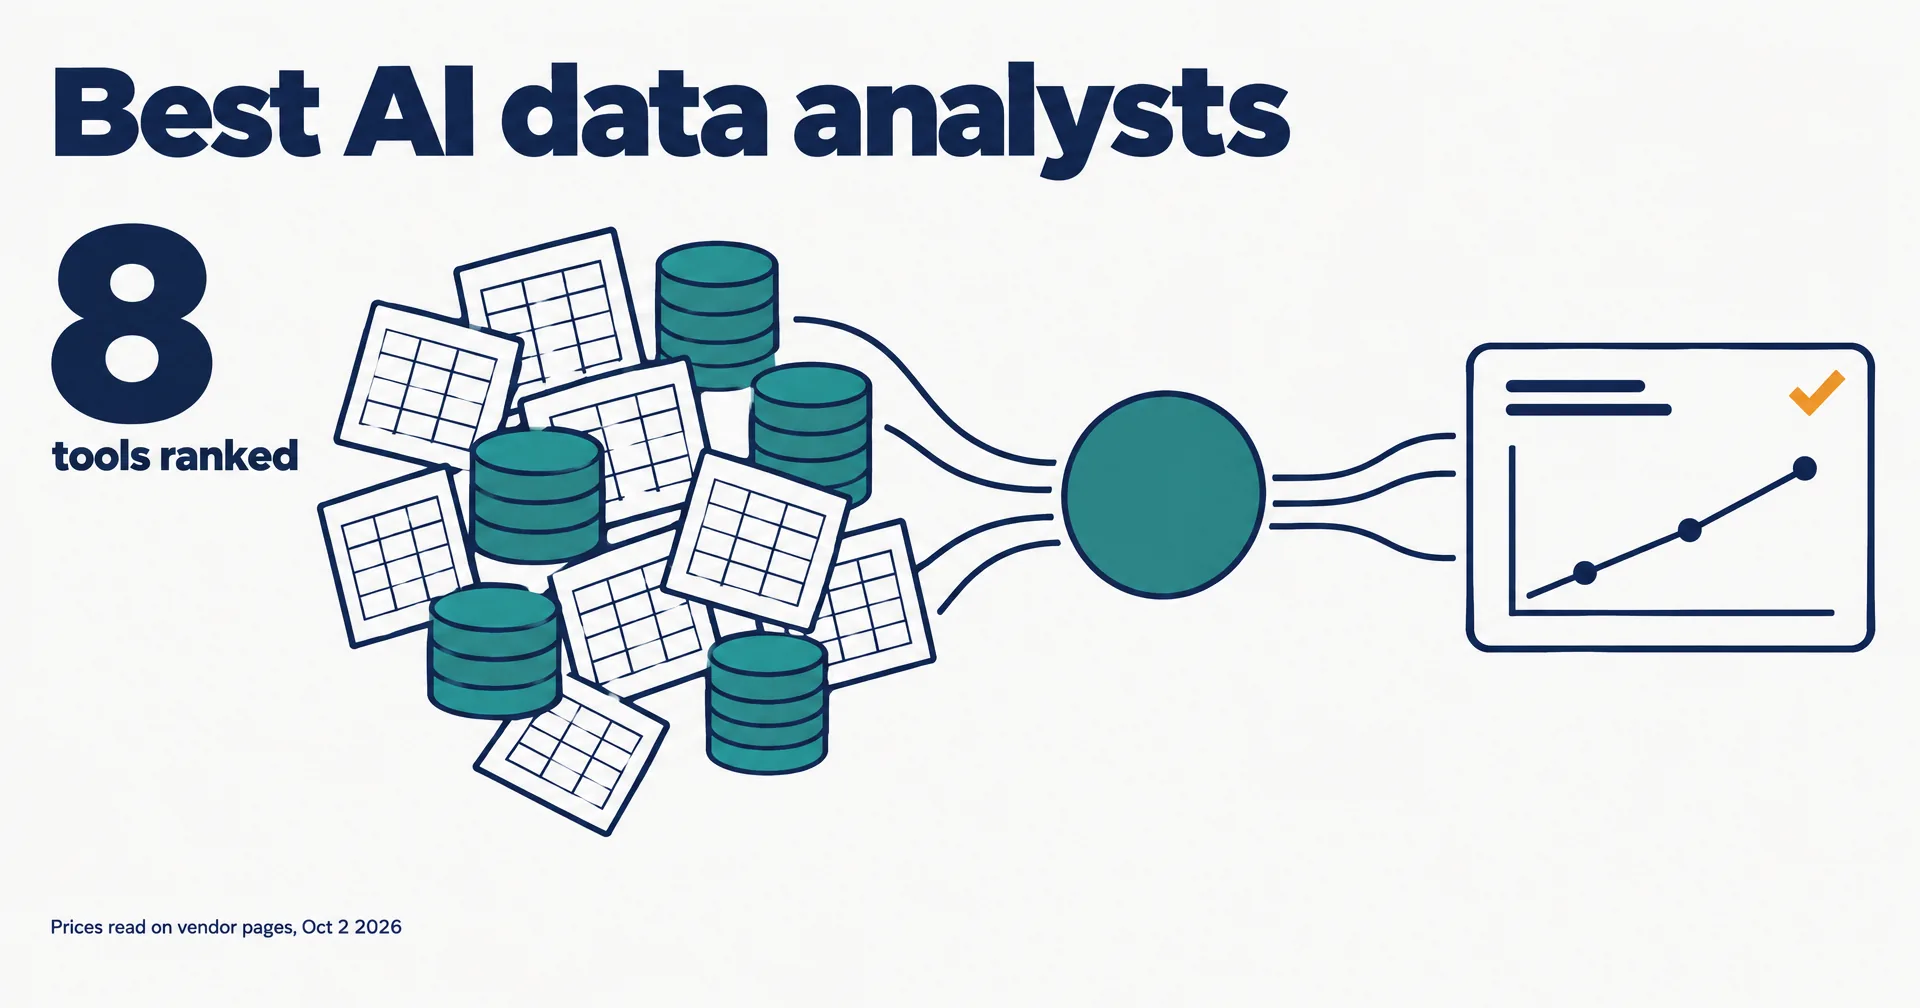
The data is usually there; the answer takes a week because someone has to write the query, clean the export and build the chart. We ranked eight AI data analyst tools on how much of that work they take off a small team, with every price read on the vendor’s own pricing page on October 2, 2026. We make CellCog, and it is in the table; the conflict is declared under it.
On this page · 9 sectionsOpen
 An AI data analyst connects to your databases and spreadsheets, writes and runs its own queries, builds dashboards and explains what changed. Most tools sold under the label do part of that.
 The category holds three kinds of tool: chat-with-your-data apps (Julius, Powerdrill, Rows), notebook and BI platforms with AI built in (Hex, ThoughtSpot, Power BI, Tableau), and AI employees that own the questions over time.
 CellCog ranks first for small teams because one AI employee queries your data read-only by default, builds live dashboards, shows the query behind every chart and sends a weekly note on what moved.
 Julius is the pick for analyzing a file on your own: a free plan, with Plus listed from $16 a month. Rows is the cheapest paid spreadsheet with AI at $8 per user a month.
 If a whole team needs dashboards, Power BI Pro is $14 per user a month and Tableau Standard starts at $15, both billed yearly; ThoughtSpot starts at $50 per user.
 Pick by who asks the questions: you, once, in a file; a team, every day, in dashboards; or an employee that keeps asking them for you every week.
§ 01Three kinds of AI data analyst
The label covers three different products, and buying the wrong kind is the usual disappointment.
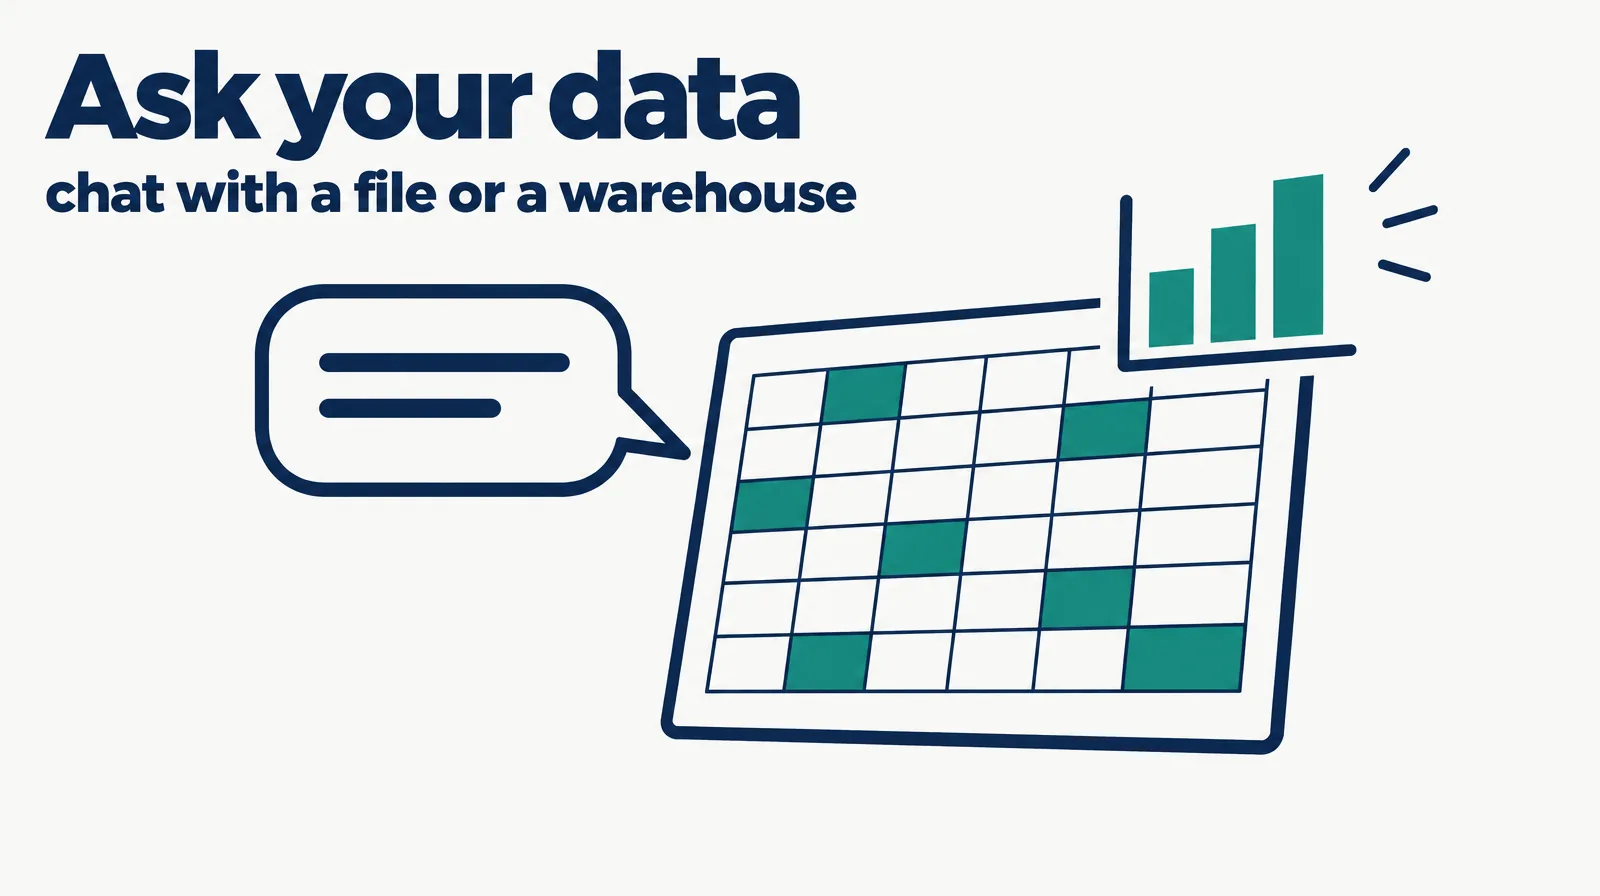
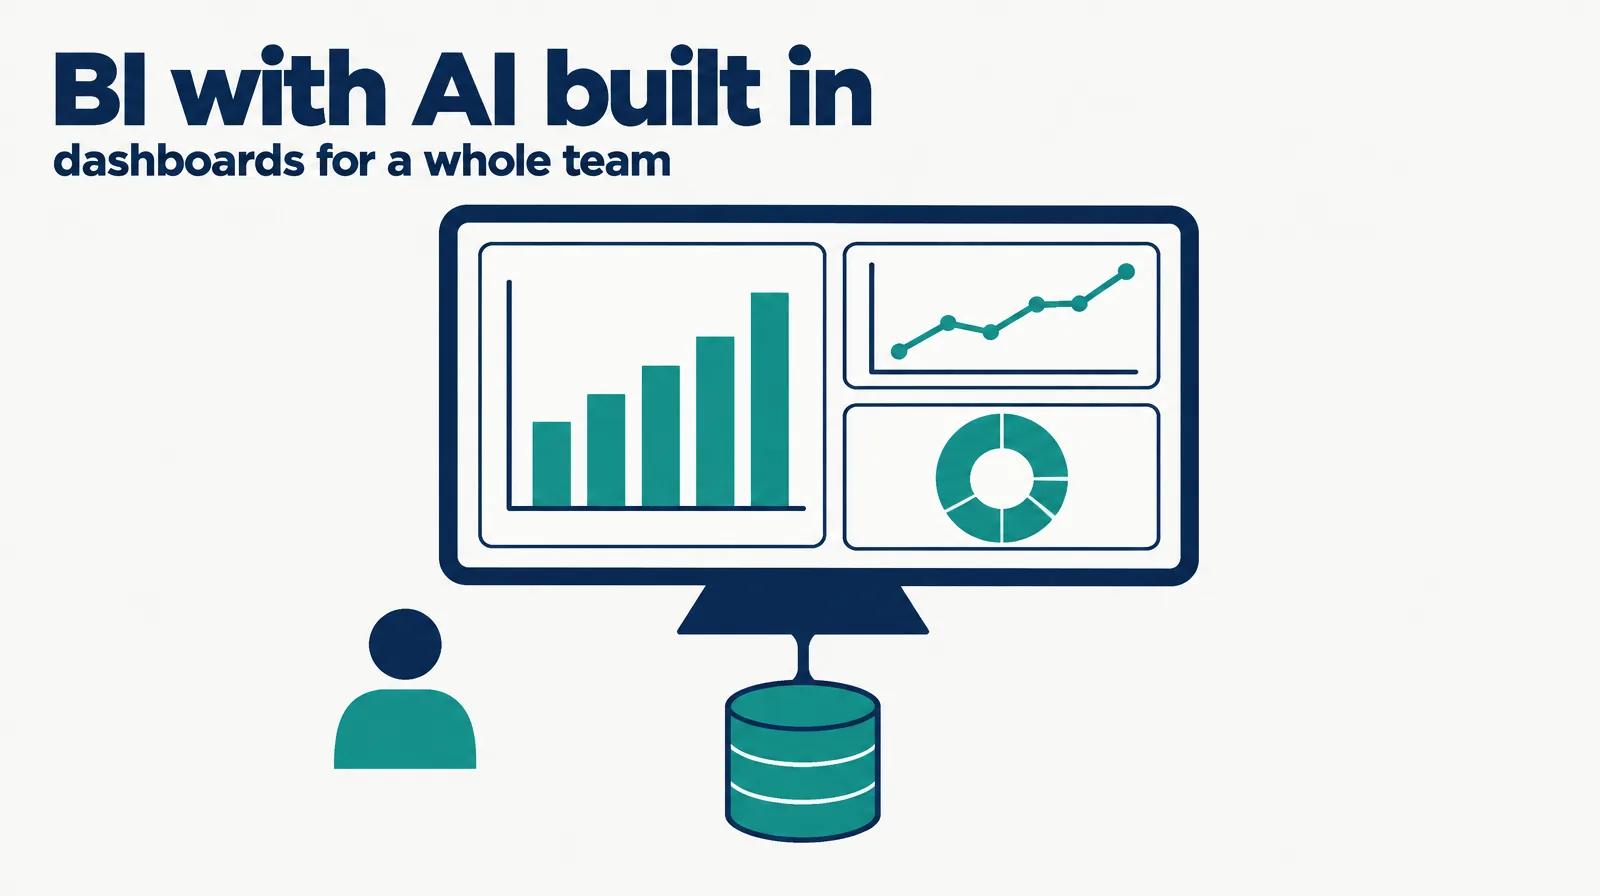
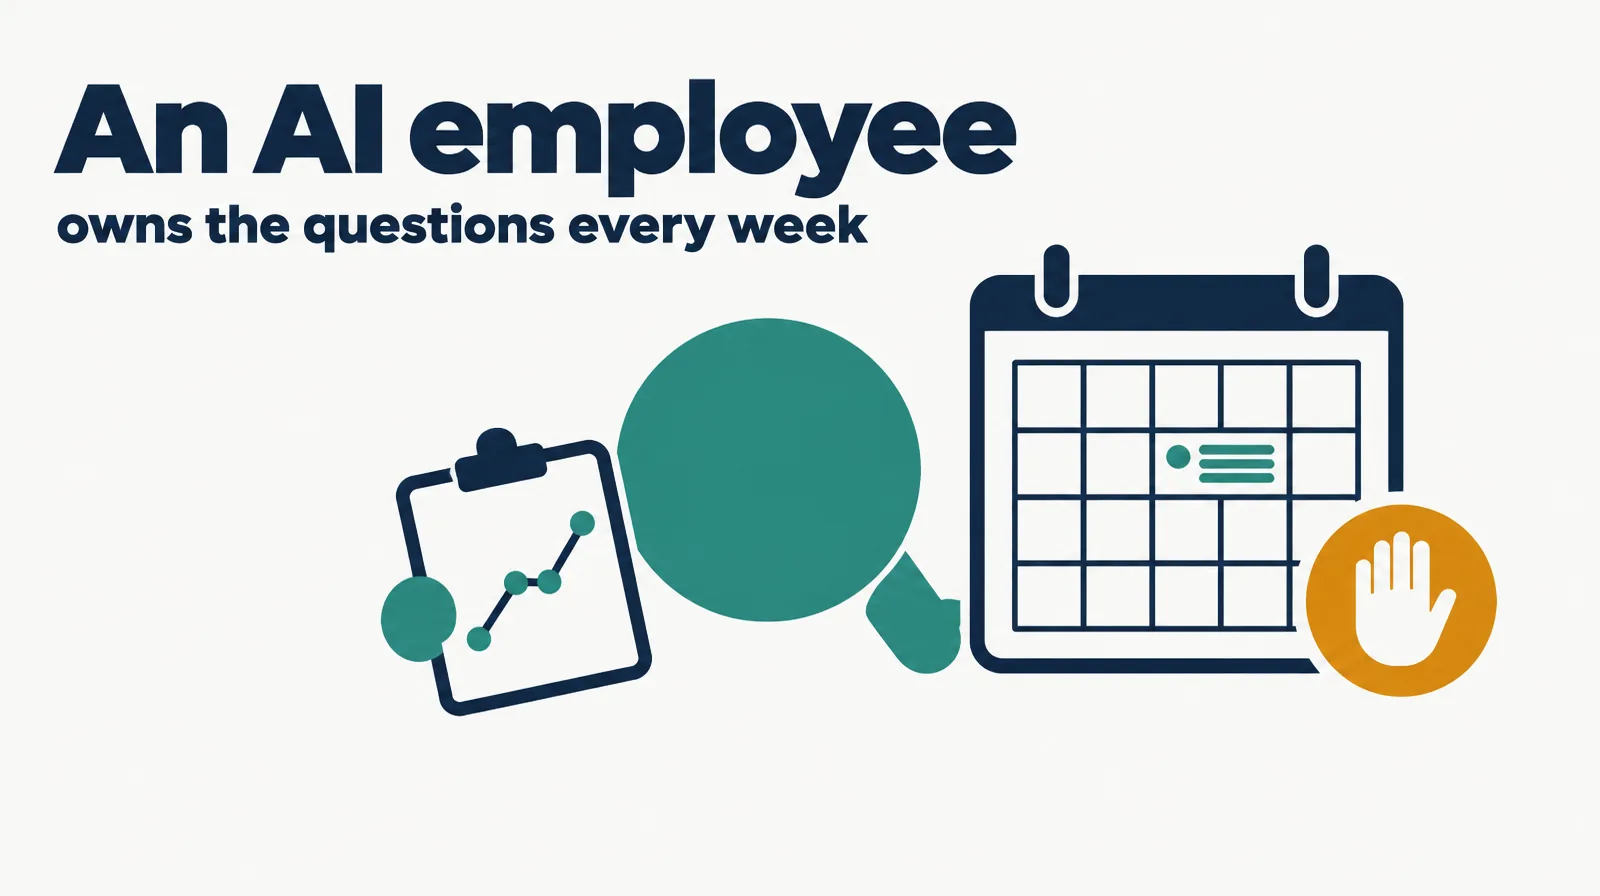
Chat-with-your-data apps answer the question you type, on the file you give them. BI platforms hold the dashboards a team watches and add AI search on top. An AI employee takes the analyst role: it connects to the data, keeps the dashboards current and reports what moved without being asked.
§ 02The AI data analyst rankings
| Rank | Tool | Cheapest listed plan | What it does | Best for |
|---|---|---|---|---|
| 1 | CellCog | Plans from $8/mo; usage-based; you pay for the work, not the hire | Connects to your database and spreadsheets read-only by default, writes its own queries, builds live dashboards, forecasts in a spreadsheet, sends a weekly note on what changed | Small teams without a data hire |
| 2 | Julius | Free plan; Plus listed from $16/mo | Chat with uploaded files and connected data; charts, reports and presentations on credits | Analyzing a file yourself |
| 3 | Hex | Free plan; Professional $36 per editor/mo | Notebook and app platform with the Hex agent; Team $75 adds scheduled runs and alerts | Data-literate teams who want notebooks |
| 4 | Powerdrill | Free plan; Pro $199/yr | Agent workspace for files and open data; charts, reports, slides and scheduled tasks | Budget analysis with reports attached |
| 5 | ThoughtSpot | Essentials from $50 per user/mo, billed annually | Search and AI agents over your company data, dashboards included | Teams that want to ask the warehouse in words |
| 6 | Power BI | Free account; Pro $14 per user/mo, billed yearly | Microsoft’s BI suite for reports and dashboards | Teams already on Microsoft |
| 7 | Tableau | Standard from $15 per user/mo, billed annually | BI and visual analytics with AI features | Teams that live in dashboards |
| 8 | Rows | Free plan; Plus $8 per user/mo | Spreadsheet with AI tasks and data integrations | The cheapest paid spreadsheet with AI |
Conflict of interest: CellCog wrote this ranking and sits at number one. The ranking rewards how much of the analyst’s job one tool owns for a small team, which is how CellCog is built. If you just want to ask questions of a file yourself, Julius at number two is the better buy, and we say so in the FAQ.
§ 03Why this order
CellCog is first because the whole analyst role sits in one AI employee: per our AI data analyst page (October 2026), it connects to your databases, spreadsheets and analytics, writes and runs the queries itself, builds live dashboards refreshed on your schedule, and explains in a short note what moved and why. Every chart comes with the query behind it. It reads by default, and anything that would change a record waits for your yes. It does not replace a governed BI rollout for a large team.
Julius is second and wins for solo analysis: a free plan and a Plus plan listed from $16 a month, with charts, reports and presentations from a file you upload. Hex is third for teams comfortable with notebooks; its agent sits on a platform data teams already trust.
Powerdrill is the budget pick for reports, and ThoughtSpot is the strongest tool for asking the warehouse in words, at a per-user price that adds up. Power BI and Tableau are where many teams already keep dashboards, and Rows is the cheapest paid way to add AI to a spreadsheet.
§ 04Cheapest listed plan, side by side
| Tool | Price | Basis |
|---|---|---|
| Rows | $8 | Plus, per user |
| Power BI | $14 | Pro, per user, paid yearly |
| Tableau | $15 | Standard, per user, billed annually |
| Julius | $16 | Plus, as listed |
| Powerdrill | $16.58 | Pro, $199 a year |
| Hex | $36 | Professional, per editor |
| ThoughtSpot | $50 | Essentials, per user, billed annually |
Per-user prices multiply with your team, and credit-based plans (Julius, Powerdrill, Hex) can run out under heavy use. CellCog is left out of the chart because it is usage-based: the cost depends on how much work you assign, and the pricing page has the figures.
§ 05Where CellCog stands, angle by angle
| Angle | CellCog | Who wins instead, if not us |
|---|---|---|
| Queries live data | Connects to your database and spreadsheets, read-only by default | |
| Shows its work | The query behind every chart | |
| Reports without being asked | A weekly note on what moved and why | |
| Governed dashboards for a large team | Builds live dashboards, not an enterprise BI rollout | Power BI, Tableau, ThoughtSpot |
| Notebook for analysts who code | Not a notebook product | Hex |
| One-off file questions, cheapest | Overkill for a single upload | Julius, Rows |
| Flat public monthly price | Usage-based, plans from $8/mo | Rows, Power BI |
§ 06How to choose
- If you want to ask questions of a file yourself, choose Julius or Rows.
- If your team already lives in dashboards, add AI where you are: Power BI, Tableau or ThoughtSpot.
- If your analysts write code, Hex.
- If nobody on the team has time to ask the questions every week, choose CellCog.
- Whatever you pick, check the first answers against a number you already know.
§ 07The honest caveats
Prices change often. Several above are yearly-billing rates, and Julius’s page shows a yearly toggle, so its monthly billing may cost more than the listed $16. Powerdrill showed a promotional first-year discount the day we read it; we list the regular $199 a year. Akkio sells through sales with custom pricing, so it is not ranked. Better Analyst (formerly Formula Bot) did not show a readable price on its page.
§ 08Update log
- October 2, 2026: page opened; prices read on each vendor’s pricing page October 2, 2026.
§ 09Sources
- Pricing pages read October 2, 2026: Julius, Hex, Powerdrill, ThoughtSpot, Power BI, Tableau, Rows, Akkio.
- CellCog, AI data analyst, October 2026.
Q1What does an AI data analyst do?
It connects to your data, writes and runs queries, cleans exports, builds charts and dashboards, forecasts in a spreadsheet and explains in plain words what changed and why.
Q2Julius or CellCog?
Julius if you want to upload a file and ask it questions yourself. CellCog if you want an AI employee that connects to your live data, keeps the dashboards fresh and tells you each week what moved.
Q3Can an AI data analyst replace Power BI or Tableau?
Not for a team that lives in governed dashboards. CellCog builds live dashboards from your data, but if you already run Power BI or Tableau, it can work alongside them.
Q4Is there a free AI data analyst?
Julius, Powerdrill, Rows and Hex all list free plans, and Power BI has a free account for building reports. CellCog lets you try it free, no credit card needed.
Q5Can I trust the numbers?
Only if you can check them. Pick a tool that shows the query or code behind every chart; CellCog shows the query with every number so anyone can rerun it.