Anthropic published The missing map of the sky on October 8, 2026, a science-blog post in which astrophysicist Brice Ménard explains how he used Claude Science to produce “the first complete map of the sky in UV light.” Ménard works at Johns Hopkins University and is also a researcher at Anthropic. @AnthropicAI posted it at 20:16 UTC.
For most readers the map is not the news. The method is: one scientist gave high-level direction, and “Claude orchestrated a team of AI agents” over several days while he worked on other projects.
On this page · 7 sectionsOpen
 Anthropic published a science-blog post on October 8, 2026 in which astrophysicist Brice Ménard describes using Claude Science to produce the first complete map of the sky in ultraviolet light.
 Claude orchestrated a team of agents that gathered public UV surveys, removed glare, cross-calibrated them and merged them into one map over several days.
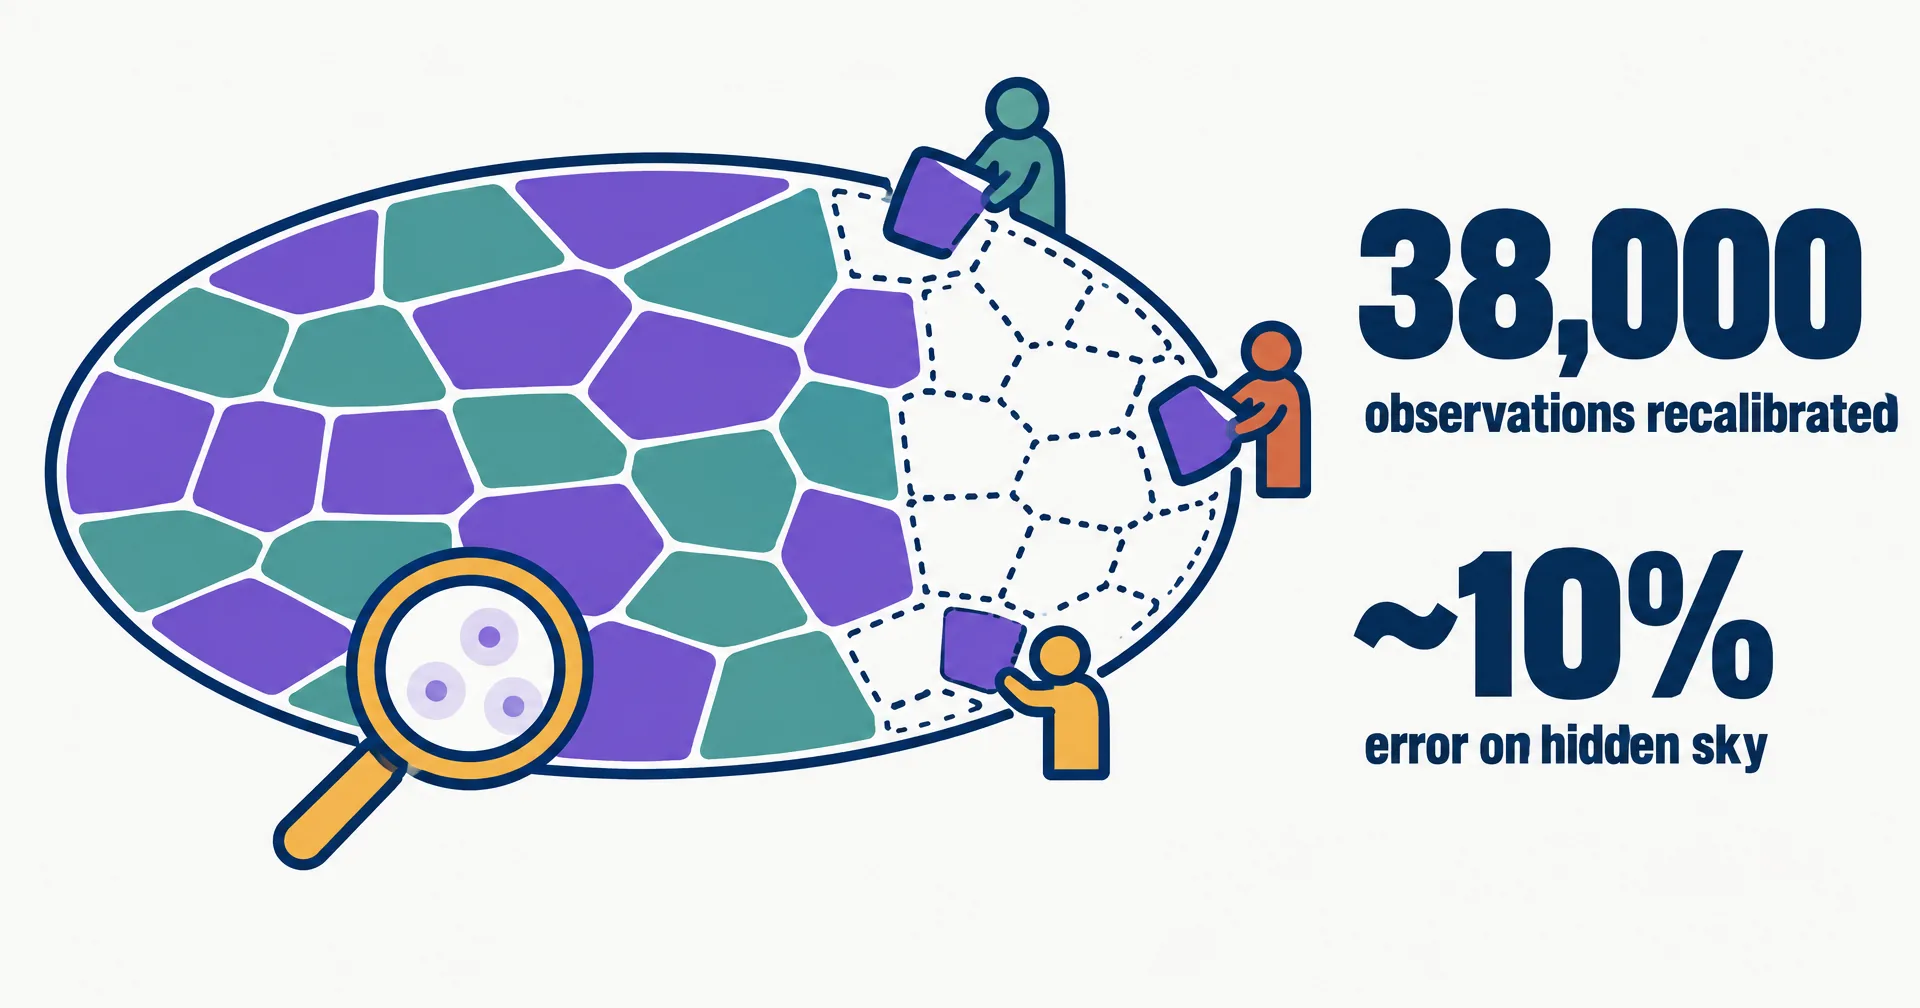
 About a third of the sky had never been observed in UV, so Claude predicted it with inpainting; on hidden test patches the estimates landed within about 10% of real measurements.
 Two rounds of review by other agents passed the map with faint observation circles still in it; Ménard spotted them and Claude fixed all 38,000 observations.
 Ménard is also an Anthropic researcher, so the post is a showcase; every pixel of the map is labelled measured or predicted.
§ 01Why no complete UV map existed
The ozone layer absorbs UV light, so the sky has to be observed in UV from space. NASA’s GALEX mission imaged about two-thirds of the sky in some 38,000 observations between 2003 and 2013. It skipped very bright regions, including the plane of the Milky Way, to protect its detectors. NASA’s Swift and South Korea’s FIMS/SPEAR filled some of the gaps, but not all of them. Ménard says doing the job properly “takes weeks of painstaking work”, the kind of project scientists keep putting off.
§ 02The map, by the numbers
| Item | Figure |
|---|---|
| GALEX observations recalibrated | About 38,000 |
| Sky observed in UV before | About two-thirds |
| Sky predicted by inpainting | About one third, including much of the galactic plane |
| Accuracy on hidden test patches | Within about 10% of real UV measurements |
| Stars added from Gaia | More than 100 million |
| Versions of the map | More than a dozen |
| Elapsed time | Several days, with the agents running for hours between check-ins |
§ 03How the agents built it
Ménard describes the pipeline in five stages:
- Gather. Agents searched the web for public UV surveys and downloaded them, tens of thousands of images for GALEX alone.
- Clean. Each survey was made internally consistent, including removing glare around bright stars. Many agents worked in parallel on different regions of the sky.
- Merge. The surveys were cross-calibrated, put on one resolution and one coordinate system, and combined.
- Fill. For the third of the sky never observed in UV, Claude used inpainting. It learned from the observed two-thirds how UV brightness relates to visible, infrared and radio light, then predicted the missing sky with an uncertainty for each point. Tested on regions with real data hidden, it landed within about 10%.
- Add stars. UV light from more than 100 million stars was estimated from ESA’s Gaia data.
Every pixel on the published map is labelled measured or predicted, with uncertainty estimates.
§ 04What the agents missed
“Claude did not get everything right on the first try.” One evening Ménard noticed faint circles in the dimmest fields. They were the footprints of individual GALEX observations, left by uneven glow from Earth’s atmosphere. Claude had listed the issue at the start of the project, “but the map had still passed two rounds of review by other agents without the problem being caught.”
He told Claude: “I can see discs with the imprint of individual observations; can you correct that?” The agents traced the glow, Claude corrected it across all 38,000 observations, and after a couple of hours of processing the circles were gone.
§ 05What this means if you run agents
Our conflict, declared: we build CellCog, and every tier of our AI employees runs on Claude Opus 5.5. The author is also an Anthropic researcher writing on Anthropic’s blog, so read it as a showcase, not an independent study. The lesson still travels. Agent teams can now take on the slow backlog work that never gets done, but more agents reviewing is not the same as a person looking. Ménard writes that his “contribution was limited to guiding them in the process”, and that guiding included catching the one defect two agent reviews passed. CellCog AI employees are built on the same split: they do the work end to end, and anything above the approval level you set waits for you. Claude’s earlier algorithm result made a similar point about research with a human checking.
§ 06What we are watching for
- More science-blog case studies from Anthropic, and whether any come from researchers outside the company.
- Use of the map. Whether astronomers cite the measured and predicted layers in their own work.
- Claude Science access, and which plans the workbench reaches.
§ 07Sources
- Anthropic, Brice Ménard, The missing map of the sky, October 8, 2026.
- Anthropic (@AnthropicAI) on X, announcement post, October 8, 2026, 20:16 UTC.
- Anthropic, Claude Science, an AI workbench for scientists.
- NASA MAST, GALEX mission archive.
- Johns Hopkins University, Brice Ménard, the UV map.
Q1Who made the UV sky map?
Brice Ménard, an astrophysicist at Johns Hopkins University and a researcher at Anthropic, working with Claude Science, which orchestrated a team of AI agents.
Q2Why did no complete UV map exist before?
UV light is absorbed by the ozone layer, so it must be observed from space. NASA’s GALEX imaged about two-thirds of the sky but skipped bright regions such as the Milky Way’s plane, and other missions left gaps too.
Q3What is inpainting?
A machine learning technique that fills missing parts of an image from their surroundings. Here Claude learned how UV brightness relates to visible, infrared and radio light, then predicted the unobserved sky with uncertainty estimates.
Q4What did the human catch?
Faint circles in dim fields, the footprints of individual GALEX observations left by uneven atmospheric glow. Two rounds of review by other agents had passed the map with them still in it.
Q5What does this mean for businesses using AI agents?
Agent teams can now do long, low-priority work end to end, but agent review is not a substitute for a person checking. CellCog AI employees do the work themselves and wait for your approval on anything above the level you set.