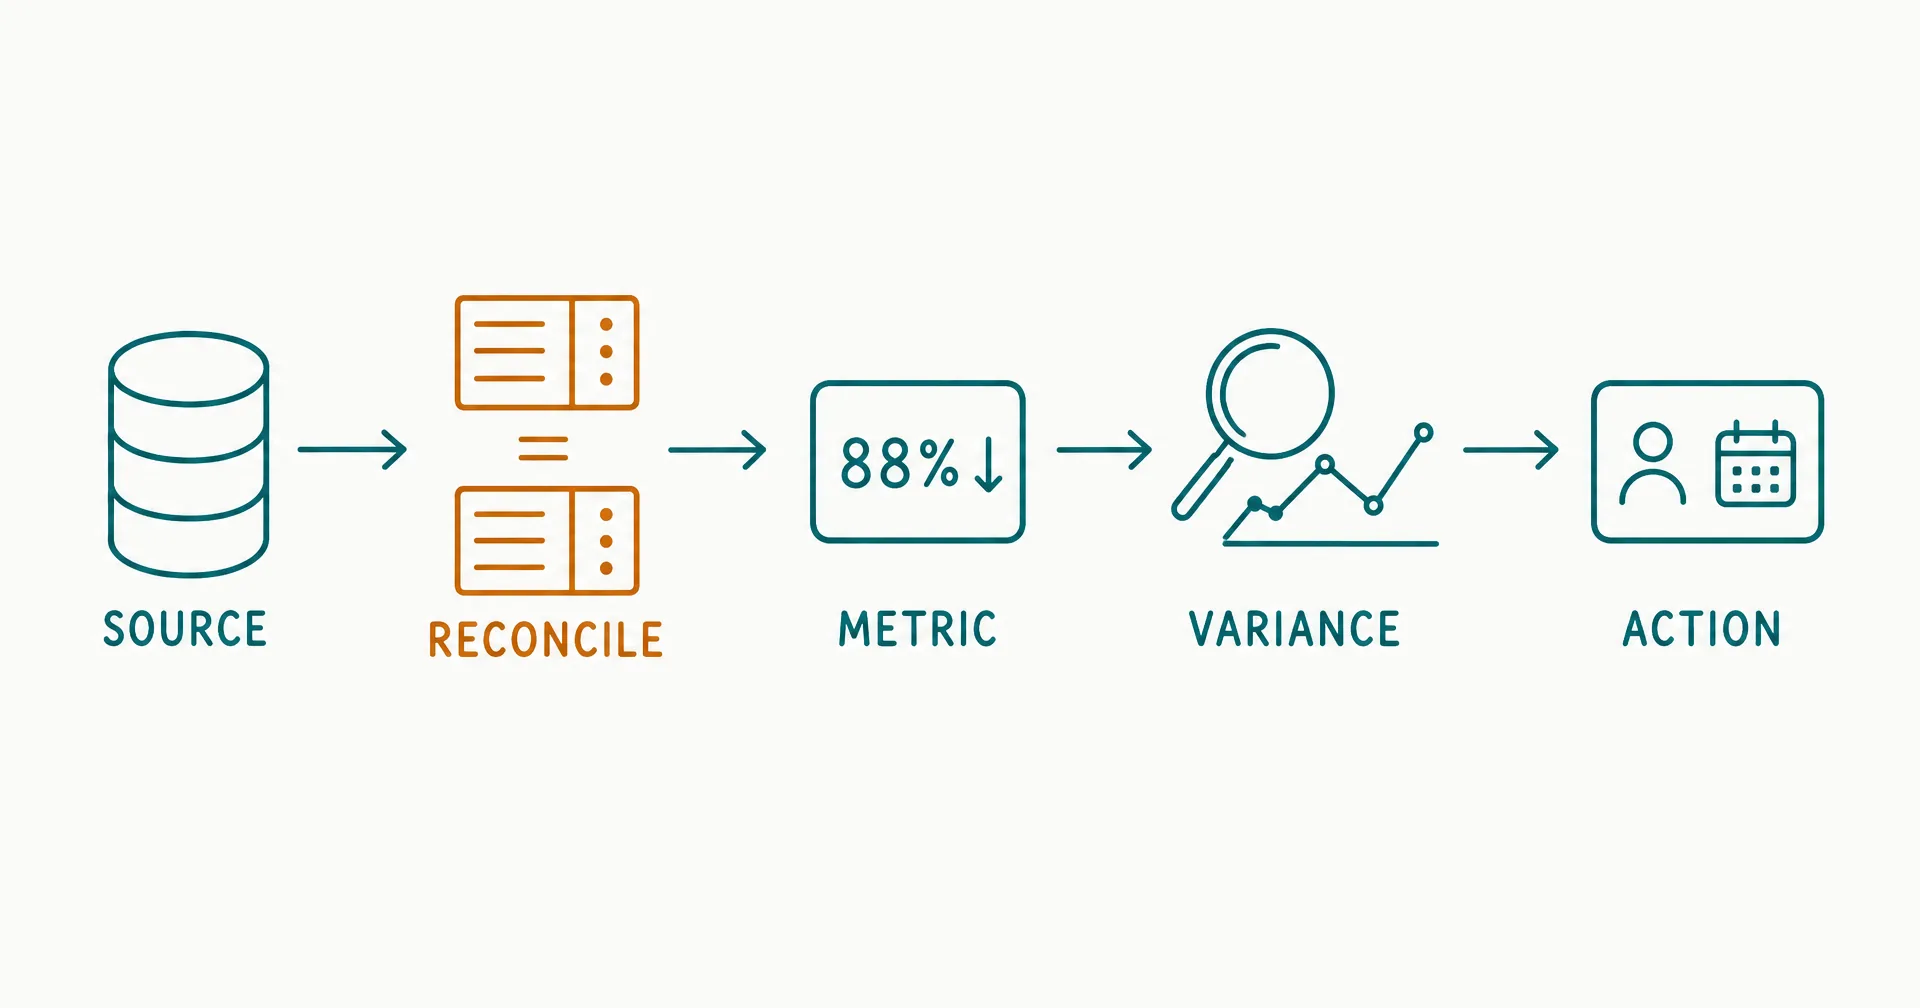
An AI KPI report is useful only when a reviewer can reproduce the number, understand the variance, accept the explanation, and assign an action.
A polished dashboard can still be wrong because:
- the metric definition changed;
- the source is incomplete;
- the period or time zone shifted;
- late events were omitted;
- duplicate records were counted;
- currency or unit conversion is inconsistent;
- an extraction succeeded but returned partial data;
- the current number and comparison use different scopes;
- a variance is statistically normal but described as exceptional;
- the explanation is plausible but unsupported;
- a chart hides the denominator;
- an owner was not assigned; or
- the action never changed downstream state.
The operating pattern is:
Decision > metric contract > source snapshot > extraction > validation > reconciliation > accepted value > comparison > variance > evidence > explanation > reviewed narrative > owner action > postcondition > close or reopen
On this page · 12 sectionsOpen
- What Is an AI KPI Reporting Workflow?
- What Should a Metric Contract Define?
- How Should Data Be Extracted and Versioned?
- How Should Validation and Reconciliation Work?
- How Should Variance and Exceptions Be Calculated?
- How Do You Explain Variance Without Inventing Causes?
- How Should the KPI Narrative Be Written?
- What Should Human Review Check?
- How Should Reports and Actions Be Distributed?
- How Should the Reporting Workflow Be Measured?
- What Does a Complete KPI Report Look Like?
- How Do You Pilot and Scale the Workflow?
- Start with a metric contract that defines the decision, formula, unit, grain, scope, period, source, exclusions, owner, thresholds, and restatement rule.
- Preserve source snapshots, query or extraction versions, transformations, checks, and accepted outputs so every material number can be reproduced.
- Reconcile totals, counts, joins, duplicates, missing values, currencies, time zones, cutoffs, and late-arriving events before calculating variance.
- Separate the observed variance from the explanation. A correlation, stakeholder comment, or model hypothesis does not prove a cause.
- Write the narrative from accepted metrics, evidence, uncertainty, and owner decisions; never let prose silently redefine the number.
- Route exceptions to named owners with due dates, required actions, and verified postconditions.
- Measure report acceptance, data defects, restatements, review demand, exception quality, action closure, cost, and severity - not reports generated.
§ 01What Is an AI KPI Reporting Workflow?
An AI KPI reporting workflow is a controlled system that converts source data into accepted metrics, evidence-backed exceptions, reviewed narrative, and owned actions.
It can support:
- weekly operating reports;
- revenue or pipeline reviews;
- customer-support scorecards;
- marketing performance;
- product adoption;
- finance and cost monitoring;
- service reliability;
- workforce capacity;
- risk and control indicators;
- executive briefs;
- board or investor preparation; and
- role-level AI employee scorecards.
The workflow should not treat every change as a story. It should distinguish:
- expected variation;
- data defect;
- definition change;
- scope or denominator change;
- operational exception;
- structural trend;
- external event;
- owner judgment;
- unresolved cause; and
- action requiring follow-through.
Dashboard versus operating report
| Dimension | Dashboard | Operating report |
|---|---|---|
| Primary job | Display current measures | Support a decision and action |
| Definition | Often implicit | Metric contract attached |
| Data state | Latest refresh | Accepted period and cutoff |
| Variance | Visual change | Tested exception |
| Explanation | Optional annotation | Evidence-backed narrative |
| Review | Viewer interpretation | Named preparer and owner acceptance |
| Action | Separate meeting | Owner, due date, postcondition |
| History | Values | Values, versions, restatements, decisions |
The AI employee examples guide shows a bounded KPI-reporting role. This article owns the full extraction-to-action workflow.
Accepted outcome
One accepted KPI report:
- uses the current metric and source contracts;
- identifies the exact reporting period and cutoff;
- preserves source and transformation lineage;
- passes defined validation and reconciliation checks;
- labels missing, estimated, corrected, and restated values;
- calculates comparisons from compatible scopes;
- separates variance from causal explanation;
- links material explanations to evidence;
- receives required human review;
- assigns accepted actions and owners; and
- verifies or reopens those actions.
“Report generated” is an intermediate state.
§ 02What Should a Metric Contract Define?
A metric contract prevents the same label from carrying several meanings.
Metric contract
| Field | Required definition |
|---|---|
| Metric ID | Stable identifier |
| Name | Reader-facing label |
| Decision | What action can change? |
| Business meaning | What does the metric represent? |
| Unit | Dollars, users, cases, minutes, percentage |
| Grain | Event, user, account, case, day, month |
| Population | Included entities and conditions |
| Numerator | Exact expression and accepted records |
| Denominator | Exact expression and zero handling |
| Exclusions | Tests, refunds, duplicates, internal accounts |
| Time | Event time, processing time, time zone, period |
| Currency | Source currency, conversion date, rate source |
| Source | Authoritative system, object, and fields |
| Transformation | Query, joins, filters, mapping, rounding |
| Freshness | Expected availability and late-data behavior |
| Quality | Completeness, validity, reconciliation checks |
| Comparison | Prior period, target, budget, cohort, baseline |
| Threshold | Warning, exception, severity override |
| Owner | Definition, data, report, and action owners |
| Restatement | When history changes and how it is disclosed |
| Version | Effective time and affected series |
Worked contract
| Field | Fictional value |
|---|---|
| Metric ID | SUPPORT.RESOLUTION.ACCEPTED_RATE |
| Decision | Inspect low-quality closure and queue policy |
| Numerator | Cases accepted by customer or QA in period |
| Denominator | Cases marked resolved in period |
| Unit | Percentage |
| Grain | Case |
| Exclusions | Test, duplicate, spam, merged child cases |
| Event time | Resolution timestamp in account time zone |
| Late data | Recompute for 7 days |
| Source | Support case and acceptance-event tables |
| Target | At least 92% |
| Warning | Below 90% for 2 periods |
| Critical | Any severe false closure |
| Owner | Support operations |
The threshold does not replace severity. One severe false closure can require action even when the rate is 94%.
Owner model
| Responsibility | Owner question |
|---|---|
| Metric owner | Does the definition support the decision? |
| Data owner | Are source fields and availability governed? |
| Pipeline owner | Is extraction and transformation reliable? |
| Report owner | Is the period package complete and reviewed? |
| Business owner | What does the accepted variance mean? |
| Action owner | What change will be made and verified? |
The AI employee KPI framework provides the broader outcome, quality, escalation, reliability, cost, risk, and activity model. This article assumes the KPI has been chosen and governs recurring production.
§ 03How Should Data Be Extracted and Versioned?
The extraction should produce a reproducible period package.
Period package
- report ID and version;
- metric-contract versions;
- reporting period;
- cutoff and retrieval time;
- source-system versions where available;
- source snapshots or immutable references;
- extraction query or job version;
- transformation code or configuration;
- mapping tables;
- time-zone and currency rules;
- validation results;
- reconciliation results;
- accepted metric table;
- comparison table;
- exception ledger;
- evidence pack;
- reviewed narrative;
- approvals;
- action ledger; and
- restatement record.
Source registry
| Field | Example |
|---|---|
| Source ID | SRC-CRM-OPP |
| System | CRM |
| Object | Opportunity history |
| Fields | ID, stage, amount, close date, changed_at |
| Authority | Canonical for opportunity state |
| Owner | Revenue operations |
| Access | Read-only reporting identity |
| Freshness | Hourly; final close after 2 days |
| Time zone | UTC storage; account-local reporting |
| Retention | 25 months in report store |
| Quality issue | Delayed stage events during bulk import |
| Version | Contract v4.2 |
Extraction control
| Control | Pass condition |
|---|---|
| Authentication | Approved reporting identity used |
| Scope | Expected tenant, accounts, and period |
| Pagination | All pages retrieved |
| Row count | Within expected and reconciled range |
| Schema | Required fields and types match |
| Nulls | Required fields complete or classified |
| Duplicates | Stable key and duplicate rule applied |
| Cutoff | Exact time recorded |
| Retry | Cannot duplicate or mix snapshots |
| Hash/reference | Source artifact can be identified |
| Logs | Start, end, result, errors, version retained |
An API status of 200 does not prove that pagination completed, the tenant was correct, or late data was included.
The U.S. Government Accountability Office’s current Green Book sets internal-control standards for federal agencies and frames reliable operational reporting as a control objective. Its specific requirements apply to its stated users; the portable lesson is that reliable reporting needs designed, implemented, and operating controls - not only a finished output.
The UK Government Analysis Function’s Reproducible Analytical Pipelines strategy describes using software-engineering practices to improve reproducibility in analysis and emphasizes appropriate quality assurance. A commercial workflow can apply the same principle without claiming government-statistics status.
Preserve provenance
W3C’s Data on the Web Best Practices recommend metadata, provenance, quality information, version indicators, stable identifiers, and explanations for unavailable data. Those practices are useful when a report passes between systems or teams that do not share all the original context.
The multimodal-agent guide explains how data, code, chart, narrative, slide, and final artifact can remain distinct versioned objects.
§ 04How Should Validation and Reconciliation Work?
Validation asks whether fields and records conform. Reconciliation asks whether the whole period balances to accepted control totals.
Validation checks
| Dimension | Example check |
|---|---|
| Completeness | Required IDs, timestamps, amounts present |
| Uniqueness | One accepted record per stable key |
| Validity | Status and currency in approved domains |
| Consistency | Close date follows create date |
| Referential integrity | Every child maps to valid parent |
| Timeliness | Data arrived before accepted cutoff |
| Accuracy proxy | Sample matches source-system view |
| Range | Values inside physically/business-possible bounds |
| Distribution | Unexpected shifts investigated |
| Schema | Fields, types, and mappings match contract |
Reconciliation hierarchy
- source-system control total;
- raw extracted total;
- normalized total;
- filtered in-scope total;
- joined/enriched total;
- metric numerator and denominator;
- report table total;
- chart and narrative value.
Every step should explain additions, removals, and transformations.
Reconciliation ledger
| Step | Records | Amount | Difference | Explanation |
|---|---|---|---|---|
| Source closed orders | 12,440 | $8,912,000 | - | Control total |
| Extracted | 12,440 | $8,912,000 | 0 | Complete |
| Remove test orders | 12,382 | $8,901,200 | 58 / $10,800 | Approved exclusion |
| Merge duplicates | 12,371 | $8,895,700 | 11 / $5,500 | Stable-key rule |
| Exclude refunded | 12,244 | $8,721,900 | 127 / $173,800 | Metric contract |
| Convert currencies | 12,244 | $8,734,180 | +$12,280 | Approved rate table |
| Accepted metric input | 12,244 | $8,734,180 | 0 | Reconciled |
All figures are illustrative.
Join checks
| Join risk | Check |
|---|---|
| One-to-many explosion | Row count and amount before/after |
| Missing dimension | Unmatched-key count |
| Stale mapping | Effective-time match |
| Duplicate dimension | Key uniqueness |
| Cross-tenant join | Tenant/account equality |
| Currency mismatch | Currency present before summing |
| Time-zone shift | Boundary-event sample |
Missing and estimated values
Use explicit states:
- actual;
- late;
- missing;
- estimated;
- imputed;
- corrected;
- restated;
- suppressed;
- not applicable; and
- not yet accepted.
Do not convert missing data to zero unless the metric contract explicitly defines that behavior.
Control the reporting close
A recurring report needs a close calendar. Without one, the workflow can compare a provisional current period with a fully matured prior period and call the difference operational.
| Close event | Example time | Required evidence |
|---|---|---|
| Event period ends | Sunday 23:59 local | Period boundary |
| Source ingestion checkpoint | Monday 04:00 | Source completion status |
| Initial extraction | Monday 05:00 | Job and snapshot IDs |
| Data-owner confirmation | Monday 08:00 | Known delays and incidents |
| Validation/reconciliation | Monday 10:00 | Check results |
| Metric close | Monday 12:00 | Accepted/provisional state |
| Business explanation | Monday 15:00 | Evidence and owner comment |
| Report review | Tuesday 09:00 | Decisions and corrections |
| Release | Tuesday 12:00 | Exact approved version |
| Late-data recheck | Following Monday | Restatement decision |
The schedule is illustrative. The important control is that each event changes the permitted state of the metric. Before metric close, the AI data employee may prepare and validate. It should not present a provisional value as final. After release, a changed source should create a restatement assessment rather than silently replacing history.
Record the close status for every metric:
- open;
- extraction complete;
- source delayed;
- validation failed;
- reconciliation failed;
- provisional;
- accepted;
- released;
- restatement under review;
- restated; or
- retired.
Suppose a source normally matures by Monday 04:00 but reports a partial-load incident. A successful 05:00 query does not override that warning. The report can wait, narrow its scope, or release a clearly provisional value under the metric contract. If the dashboard refreshes automatically, its state label and downstream narrative should change together.
Sample the records behind the aggregate
Aggregate reconciliation can pass while individual records are wrong in offsetting directions. Use risk-based sampling:
| Sample | Purpose |
|---|---|
| Largest values | Detect concentration and material classification errors |
| Boundary events | Test time zone, cutoff, and period |
| New categories | Test mapping and definition coverage |
| Corrected records | Verify source-to-report propagation |
| Missing/estimated values | Confirm explicit state |
| Exceptions | Verify that the record supports the alert |
| Random cases | Detect defects outside known patterns |
| Prior failures | Run regression cases |
The sample result should link to the metric version and period. A discovered material defect reopens the affected checks even when the total happens to remain unchanged.
§ 05How Should Variance and Exceptions Be Calculated?
Variance should compare compatible values and produce an exception only under an accepted rule.
Comparison contract
| Comparison | Use | Main risk |
|---|---|---|
| Prior period | Short-term change | Seasonality and period length |
| Prior year | Seasonal comparison | Business model changed |
| Target | Management intent | Target became stale |
| Budget | Financial control | Scope and timing differ |
| Forecast | Expectation error | Forecast version mismatch |
| Cohort | Like-for-like behavior | Selection and maturity |
| Control limit | Unusual process variation | Insufficient stable history |
| External benchmark | Context | Definition and population mismatch |
Core formulas
Absolute variance = current - comparison
Percentage variance = (current - comparison) / |comparison|
Rate difference in percentage points = current rate - comparison rate
Do not call a change from 40% to 50% a 10% increase. It is 10 percentage points or a 25% relative increase.
Exception contract
| Field | Required definition |
|---|---|
| Metric | Accepted metric ID/version |
| Comparison | Exact baseline or target |
| Direction | High, low, either |
| Threshold | Absolute, relative, control limit |
| Minimum denominator | Avoid unstable small samples |
| Persistence | One period or repeated |
| Severity override | Consequence independent of rate |
| Suppression | Accepted maintenance or known event |
| Owner | Person who evaluates and acts |
| Expiry | When the exception is re-evaluated |
Threshold example
| Rule | Result |
|---|---|
| Warn below 92% with at least 200 cases | Creates review exception |
| Critical below 85% | Immediate owner route |
| Critical on any severe false closure | Severity override |
| Suppress if denominator under 30 | Show value, no automatic rate judgment |
| Reopen if restatement changes direction | Prior decision re-reviewed |
These rules are illustrative.
Exception states
Detected > validated > accepted/false-positive/data-defect > explained/unexplained > action assigned > verified/expired/reopened
The exception should preserve the value even when the alert is suppressed. Suppression changes notification behavior, not history.
§ 06How Do You Explain Variance Without Inventing Causes?
The number shows what changed. Evidence supports why.
Explanation ladder
| Level | Statement | Evidence state |
|---|---|---|
| Observation | Resolution rate fell 4.2 points | Accepted metric |
| Decomposition | Most decline came from billing cases | Accepted segment analysis |
| Association | Decline coincided with policy release | Correlation |
| Stakeholder evidence | Reviewers report rule ambiguity | Interview/operating evidence |
| Mechanism | New rule created two interpretations | Supported process explanation |
| Causal claim | Policy release caused the decline | Needs stronger design/evidence |
| Forecast | Clarification should restore rate | Prediction with assumptions |
Stop at the highest supported level.
Evidence pack
- accepted current and comparison tables;
- segment and cohort decomposition;
- source and contract versions;
- release, campaign, staffing, incident, and policy timeline;
- customer or reviewer examples;
- sampled source records;
- owner comments;
- counterevidence;
- known changes;
- unresolved hypotheses; and
- follow-up test.
Hypothesis ledger
| Hypothesis | Supporting evidence | Contradicting evidence | Status |
|---|---|---|---|
| Policy ambiguity raised correction | Billing decline and reviewer comments | Some regions stable | Plausible |
| Staffing caused delay | Queue rose during 2 absences | Quality fell before absence | Weak |
| Source extract incomplete | Lower row count | Control total reconciles | Rejected |
| Customer mix shifted | New segment share rose 18% | Within-segment decline remains | Partial |
Ask counterfactual questions
- Would the metric have changed without the proposed cause?
- Did unaffected groups remain stable?
- Did timing match the mechanism?
- Is the relationship present across multiple periods?
- Did another change occur at the same time?
- Can the result be reproduced from source records?
- Which evidence would disprove the explanation?
The article should say “cause unknown” when the available evidence supports only an observation or association.
§ 07How Should the KPI Narrative Be Written?
Write the narrative from accepted objects.
Narrative structure
- decision and reporting period;
- accepted metric and comparison;
- material exception;
- validated decomposition;
- supported explanation and uncertainty;
- customer, financial, operational, or risk consequence;
- owner decision;
- action, due date, and postcondition;
- unresolved questions; and
- restatement or update note.
Sentence contract
| Narrative element | Must reference |
|---|---|
| Number | Metric ID, period, accepted value |
| Comparison | Compatible baseline and version |
| Change | Absolute/relative formula |
| Cause | Evidence item and qualification |
| Forecast | Assumptions and range |
| Recommendation | Decision owner |
| Action | Owner, due date, postcondition |
| Status | Current action and report version |
Weak versus useful
Weak:
Customer satisfaction dropped because support was understaffed. The team will improve training.
Useful:
Accepted satisfaction fell from 4.42 to 4.18, a decline of 0.24 points, across 1,840 responses. Billing cases contributed 71% of the weighted decline. Two reviewer samples found conflicting use of refund policy v3.1; staffing data did not explain the timing. The billing owner will publish a clarified decision table by August 4 and rerun 40 representative cases. Cause remains qualified until the rerun and next-period result.
The useful version exposes the metric, denominator, decomposition, counterevidence, uncertainty, owner, action, and verification.
Tables and charts
Every visual should expose:
- metric name and unit;
- reporting period;
- denominator where relevant;
- comparison;
- source or report ID;
- missing/estimated/restated state;
- readable labels;
- scale and zero treatment;
- owner annotation where needed; and
- accessible text equivalent.
A chart should not use a narrower axis merely to dramatize a routine change.
The U.S. Securities and Exchange Commission’s guidance on KPIs and metrics in MD&A applies to its specific disclosure context. Its focus on clear definitions, calculation, presentation, reasons a metric is useful, and changes in method is a useful reminder that a business metric should not rely on a label alone. Qualified legal and finance reviewers should determine any disclosure duty.
§ 08What Should Human Review Check?
Review should follow the consequence of the report.
Review gates
| Gate | Reviewer | Main question |
|---|---|---|
| Contract | Metric owner | Is the current definition used? |
| Source | Data owner | Is the source complete and authoritative? |
| Pipeline | Analyst/engineering | Can the result be reproduced? |
| Reconciliation | Finance/operations | Do totals and adjustments balance? |
| Variance | Analyst | Are comparisons compatible? |
| Explanation | Business owner | Does evidence support the mechanism? |
| Narrative | Report owner/editor | Is wording accurate and bounded? |
| Risk/legal | Qualified reviewer | Does consequence or disclosure require review? |
| Action | Accountable owner | Is the response accepted and feasible? |
| Release | Publisher | Is this exact version authorized? |
Review packet
- report and period IDs;
- contract and source versions;
- validation and reconciliation results;
- current and comparison metrics;
- exception ledger;
- evidence and hypothesis ledgers;
- narrative diff from prior version;
- action ledger;
- changed definitions or methods;
- restatements;
- blocked or missing metrics; and
- approval and release destination.
Review decisions
- accept;
- accept with qualification;
- return for data correction;
- return for explanation evidence;
- restate prior period;
- suppress distribution but preserve record;
- narrow audience;
- replace action;
- defer pending source close;
- incident or control escalation; or
- reject report.
The executive-briefing workflow can use accepted KPI output to frame decisions, uncertainty, options, and actions. It should not independently recalculate or redefine the metric.
§ 09How Should Reports and Actions Be Distributed?
Distribution is an authorized state change.
Release gate
| Check | Pass condition |
|---|---|
| Version | Exact accepted report identified |
| Period | Start, end, cutoff, and time zone correct |
| Contracts | Effective versions attached |
| Data | Validation and reconciliation pass |
| Exceptions | Accepted statuses and owners |
| Narrative | Numbers and explanations trace |
| Visuals | Labels, scales, and accessibility pass |
| Restatements | Prior changes disclosed |
| Audience | Correct people and access |
| Actions | Owners and due dates accepted |
| Recovery | Correct, replace, retract, or notify path |
Audience control
| Audience | Appropriate detail |
|---|---|
| Operating team | Record-level drill-down within access |
| Department leader | Exceptions, trends, actions |
| Executive | Decision-relevant measures and uncertainty |
| Board/investor | Qualified disclosure process |
| Customer | Contractually and legally appropriate information |
| Public | Approved and reviewed disclosure |
Do not place customer-level, employee-level, or sensitive control evidence into a wider report because the aggregate chart is harmless.
Action contract
| Field | Example |
|---|---|
| Action ID | ACT-7008 |
| Exception | EX-SUPPORT-014 |
| Decision | Clarify refund decision table |
| Owner | Billing operations lead |
| Due | August 4, 2026 |
| Evidence due | Approved table v3.2 and 40-case rerun |
| Postcondition | First-pass acceptance rate at least 90% |
| Monitor | Weekly for 4 periods |
| Escalation | Support director if due date missed |
| Status | Accepted |
The task-board guide helps represent action ownership, waiting states, evidence, deadlines, acceptance, and reopening.
The audit-log guide provides the request, source version, approval, release, destination, postcondition, correction, and final-state record.
Control corrections and restatements
A correction changes the current report package before release. A restatement changes a value or conclusion that was already released. Treat those as different states.
| Situation | Default handling |
|---|---|
| Typo with no meaning change before release | Correct in current version |
| Metric value changes before approval | Re-run affected checks and review |
| Released value changes immaterially | Apply owner-approved disclosure rule |
| Released material value changes | Restate and notify affected audience |
| Definition changes prospectively | New contract version and series break |
| Definition applied to history | Recalculate, preserve prior series, disclose |
| Source backfill changes exception | Reopen explanation and action |
| Correction reverses decision | Notify decision owner and reassess action |
A restatement packet should contain:
- affected report, metric, period, and audience;
- original and corrected values;
- absolute and relative difference;
- reason and source evidence;
- whether the definition or data changed;
- affected charts, narrative, exceptions, decisions, and actions;
- reviewer and approval;
- notification route;
- replacement version;
- preserved prior version; and
- prevention or monitoring change.
For example, assume a released value of 91.4% changes to 88.9% after 73 late cases arrive. The 2.5-point difference crosses the 90% warning threshold and changes the report from “within range” to “exception.” The workflow must not merely refresh the dashboard. It should create the restatement, reopen the exception, notify the report and business owners, reconsider the narrative, and inspect any action that depended on the earlier conclusion.
Keep distribution and drill-down synchronized
If an executive PDF shows 88.9%, the dashboard shows 91.4%, and the analyst notebook shows 89.1%, readers cannot tell which version governs. Every destination should expose:
- accepted report ID;
- data-as-of time;
- metric-contract version;
- restatement indicator;
- link to the governing package; and
- access-appropriate drill-down.
Retire or mark superseded outputs. A downloadable file does not become harmless merely because a newer dashboard exists.
§ 10How Should the Reporting Workflow Be Measured?
Measure accepted reports and actions, not generated files.
Workflow KPI system
| Layer | Metric |
|---|---|
| Intake | Metrics due, blocked, retired |
| Source | Freshness, completeness, extraction success |
| Quality | Validation defects, reconciliation differences |
| Production | Reports accepted first pass, restatements |
| Flow | Cycle time, waiting time, queue age |
| Review | Review and correction minutes |
| Exception | True exception, false alert, missed exception |
| Narrative | Unsupported explanation, number mismatch |
| Action | Accepted, overdue, verified, reopened |
| Decision | Decisions supported and changed |
| Cost | Full cost per accepted report/action |
| Risk | Material misstatement, access, disclosure incident |
Core formulas
First-pass report acceptance = reports accepted without correction / reports reviewed
Restatement rate = reports restated after release / reports released
Exception precision = accepted material exceptions / reviewed exceptions
Action closure yield = actions with verified postcondition / actions due
Full cost per accepted report = total workflow cost / accepted reports
Fictional quarterly scorecard
| Result | Count/rate |
|---|---|
| Reports due | 156 |
| Reports released | 152 |
| Blocked for unresolved data | 4 |
| Accepted first pass | 119 of 156, 76.3% |
| Accepted after correction | 33 of 156, 21.2% |
| Restated after release | 3 of 152, 2.0% |
| Metrics produced | 1,824 |
| Validation defects before release | 68 |
| Reconciliation differences before release | 17 |
| Material exceptions reviewed | 284 |
| Accepted material exceptions | 211 of 284, 74.3% |
| Assigned actions due | 126 |
| Verified action closures | 103 of 126, 81.7% |
| Reopened actions | 9 |
| Review and correction | 18,240 minutes |
| Minutes per accepted report | 120 |
| Full quarterly cost | $84,000 |
| Cost per accepted report | $552.63 |
| Severe unresolved reporting incidents | 0 |
All figures are illustrative.
The 76.3% first-pass acceptance and 120 review minutes per accepted report indicate an upstream quality or contract problem. The 81.7% verified action-closure yield shows that producing the narrative is not the main bottleneck.
Counter gaming
| Metric alone | Bad behavior | Countermeasure |
|---|---|---|
| Reports generated | Release unreviewed files | Accepted-report count |
| On-time rate | Publish partial data | Completeness and restatement |
| Low variance | Smooth or suppress change | Source reconciliation and history |
| Action closure | Mark tasks done | Verified postcondition and reopen |
| Low cost | Exclude reviewer demand | Full-cost ledger |
| Few exceptions | Raise thresholds | Missed-exception audit |
§ 11What Does a Complete KPI Report Look Like?
Consider a fictional weekly customer-support report.
Contract
- Metric: accepted resolution rate.
- Numerator: cases accepted by customer or QA during the week.
- Denominator: cases marked resolved during the week.
- Exclusions: test, spam, duplicates, merged child cases.
- Period: Monday 00:00 through Sunday 23:59 in account-local time.
- Late data: restate for 7 days.
- Target: 92%.
- Warning: below 90% for 2 periods with at least 200 cases.
- Severity override: any severe false closure.
Reconciliation
| Step | Cases | Difference |
|---|---|---|
| Source resolved events | 2,184 | - |
| Remove tests/spam | 2,153 | 31 |
| Merge duplicates/children | 2,112 | 41 |
| Add accepted late events | 2,120 | +8 |
| Accepted denominator | 2,120 | 0 |
| Accepted numerator | 1,865 | - |
Accepted resolution rate = 1,865 / 2,120 = 87.97%
Prior comparable period:
1,976 / 2,104 = 93.92%
Change:
87.97% - 93.92% = -5.95 percentage points
Decomposition
| Segment | Current | Prior | Weighted contribution |
|---|---|---|---|
| Billing | 79.2% | 92.0% | -4.23 points |
| Access | 91.0% | 93.5% | -0.71 points |
| Product how-to | 95.4% | 95.8% | -0.12 points |
| Technical | 88.7% | 90.2% | -0.89 points |
| Total | 87.97% | 93.92% | -5.95 points |
Figures are illustrative.
Evidence
- Billing policy changed from v3.0 to v3.1 on Tuesday.
- Two approved reviewers found 7 of 20 billing cases used conflicting exception wording.
- Staffing hours fell 3%, but the rate decline began before the absence window.
- Source totals, case joins, and late events reconcile.
- No product incident affected the full period.
- The mechanism is plausible but not yet confirmed by a controlled rerun.
Reviewed narrative
Accepted resolution rate was 87.97% for 2,120 resolved cases, down 5.95 percentage points from the comparable prior period. Billing cases contributed 4.23 points of the decline. A 20-case review found conflicting use of refund policy v3.1 in 7 cases. Staffing and source completeness do not explain the timing. Billing operations will publish a clarified decision table by August 4, rerun 40 representative cases, and monitor first-pass acceptance for 4 periods. The policy mechanism remains a qualified explanation until the rerun and subsequent results are accepted.
Action ledger
| Action | Owner | Due | Postcondition | Status |
|---|---|---|---|---|
| Clarify decision table | Billing operations | Aug 4 | Version v3.2 accepted | In progress |
| Rerun evaluation | Support QA | Aug 5 | At least 36 of 40 pass | Waiting |
| Sample live cases | Support lead | Aug 12 | First-pass at least 90% | Waiting |
| Recheck metric | Report owner | Aug 12 | Reconciled new period | Waiting |
The report closes only when the reporting package is accepted. The exception remains open until its action postcondition is verified or the owner records a different decision.
§ 12How Do You Pilot and Scale the Workflow?
Begin with one KPI whose source and business owner already exist.
Four-week pilot
| Week | Focus | Exit condition |
|---|---|---|
| 1 | Metric/source contract and history | Owners approve definition and controls |
| 2 | Extraction, validation, reconciliation | Period reproduces and balances |
| 3 | Variance, evidence, narrative review | Explanation and release gates work |
| 4 | Action assignment and verification | Action loop closes or reopens correctly |
Pilot checklist
- One decision-relevant KPI
- Stable metric ID and version
- Numerator, denominator, unit, grain, and scope
- Period, cutoff, time zone, currency, and late-data rule
- Source registry and read-only access
- Versioned extraction and transformation
- Validation and reconciliation checks
- Compatible comparison
- Exception and severity rules
- Evidence and hypothesis ledgers
- Reviewed narrative
- Release audience and approval
- Action owner, due date, and postcondition
- Restatement and correction path
- Cost, quality, flow, and risk measures
Evaluation cases
Test:
- complete normal period;
- partial extraction;
- missing page of API results;
- duplicate records;
- one-to-many join explosion;
- missing dimension keys;
- time-zone boundary events;
- late-arriving data;
- currency conversion change;
- zero denominator;
- contract version change;
- target change;
- small-sample variance;
- severe event below rate threshold;
- plausible but unsupported cause;
- restatement that reverses the conclusion;
- action closed without postcondition; and
- confidential detail sent to the wrong audience.
Scale gates
Expand only when 2 consecutive review periods meet:
- extraction-completeness threshold;
- validation and reconciliation threshold;
- first-pass report-acceptance threshold;
- restatement threshold;
- exception-precision and missed-exception thresholds;
- reviewer-capacity threshold;
- action-closure threshold;
- zero unresolved severe incident;
- accepted decision usefulness; and
- acceptable full cost per accepted report.
Pause or narrow when:
- the same metric is restated repeatedly;
- undocumented contract changes appear;
- source and report totals drift;
- narrative values differ from tables;
- explanations become more certain than evidence;
- exceptions have no owner;
- action closure lacks postconditions;
- review time rises faster than report volume;
- sensitive drill-down reaches a broad audience; or
- report production continues after the decision no longer exists.
NIST describes its AI Risk Management Framework as a voluntary framework for incorporating trustworthiness considerations into AI design, development, use, and evaluation. Its govern, map, measure, and manage functions can help owners connect automated reporting risks to broader organizational controls.
Runbook
- Accept the decision and metric contract.
- Load the source contract and prior accepted period.
- Record period, cutoff, time zone, and versions.
- Extract through the approved read path.
- Preserve source reference and job logs.
- Validate fields, records, schema, and scope.
- Reconcile source, raw, transformed, and report totals.
- Mark missing, estimated, corrected, and late values.
- Calculate the accepted metric.
- Select a compatible comparison.
- Calculate variance and exception state.
- Build evidence and hypothesis ledgers.
- Draft the bounded narrative.
- Run metric, data, business, risk, and release review.
- Publish the exact accepted version to the correct audience.
- Assign action, owner, due date, and postcondition.
- Verify or reopen the action.
- Restate history transparently when required.
- Retire the report when it no longer drives a decision.
For CellCog, verify the current configuration and scope of the AI Data Analyst, data-analysis skill, and dashboard-web-app skill. Product capabilities change. The buyer still owns definitions, sources, access, validation, narrative, disclosure, approvals, business explanations, and actions.
Pilot one KPI with a reconciled source, explicit exception rule, reviewed narrative, and verifiable owner action before adding another dashboard or reporting cadence.
Q1Can an AI employee define the KPI itself?
It can propose a contract, find ambiguity, and test calculations. The metric and decision owners should accept the definition, scope, source, exclusions, thresholds, restatement behavior, and business use. Otherwise the workflow can optimize or report a number that means something different to each team.
Q2What should happen when data is late?
Apply the metric contract’s late-data rule. Mark the value provisional, wait for accepted close, or release with qualification. If late data changes a material conclusion, restate the affected period, notify the relevant audience, and reopen dependent decisions or actions.
Q3How do you know whether a variance is material?
Use accepted absolute, relative, persistence, denominator, and consequence rules. A small rate change can be material when it represents severe harm; a large percentage can be noise when the denominator is tiny. Human owners should review threshold changes.
Q4Should every KPI variance have an explanation?
No. Report the accepted observation and decomposition, then state that cause is unresolved when evidence is insufficient. A plausible story is not better than a clear unknown. Assign an investigation only when the decision value justifies it.
Q5Who should approve the final KPI narrative?
At minimum, the metric/report owner should verify the number and the accountable business owner should accept the interpretation and action. Data, finance, legal, risk, security, or disclosure reviewers may be required by source, consequence, audience, and organizational policy.
Q6What is the best first AI KPI reporting pilot?
Choose one decision-relevant KPI with a current source and named owner. Reproduce one historical period, reconcile it to control totals, test one exception rule, write a bounded narrative, and close one action through a verified postcondition before expanding the portfolio.