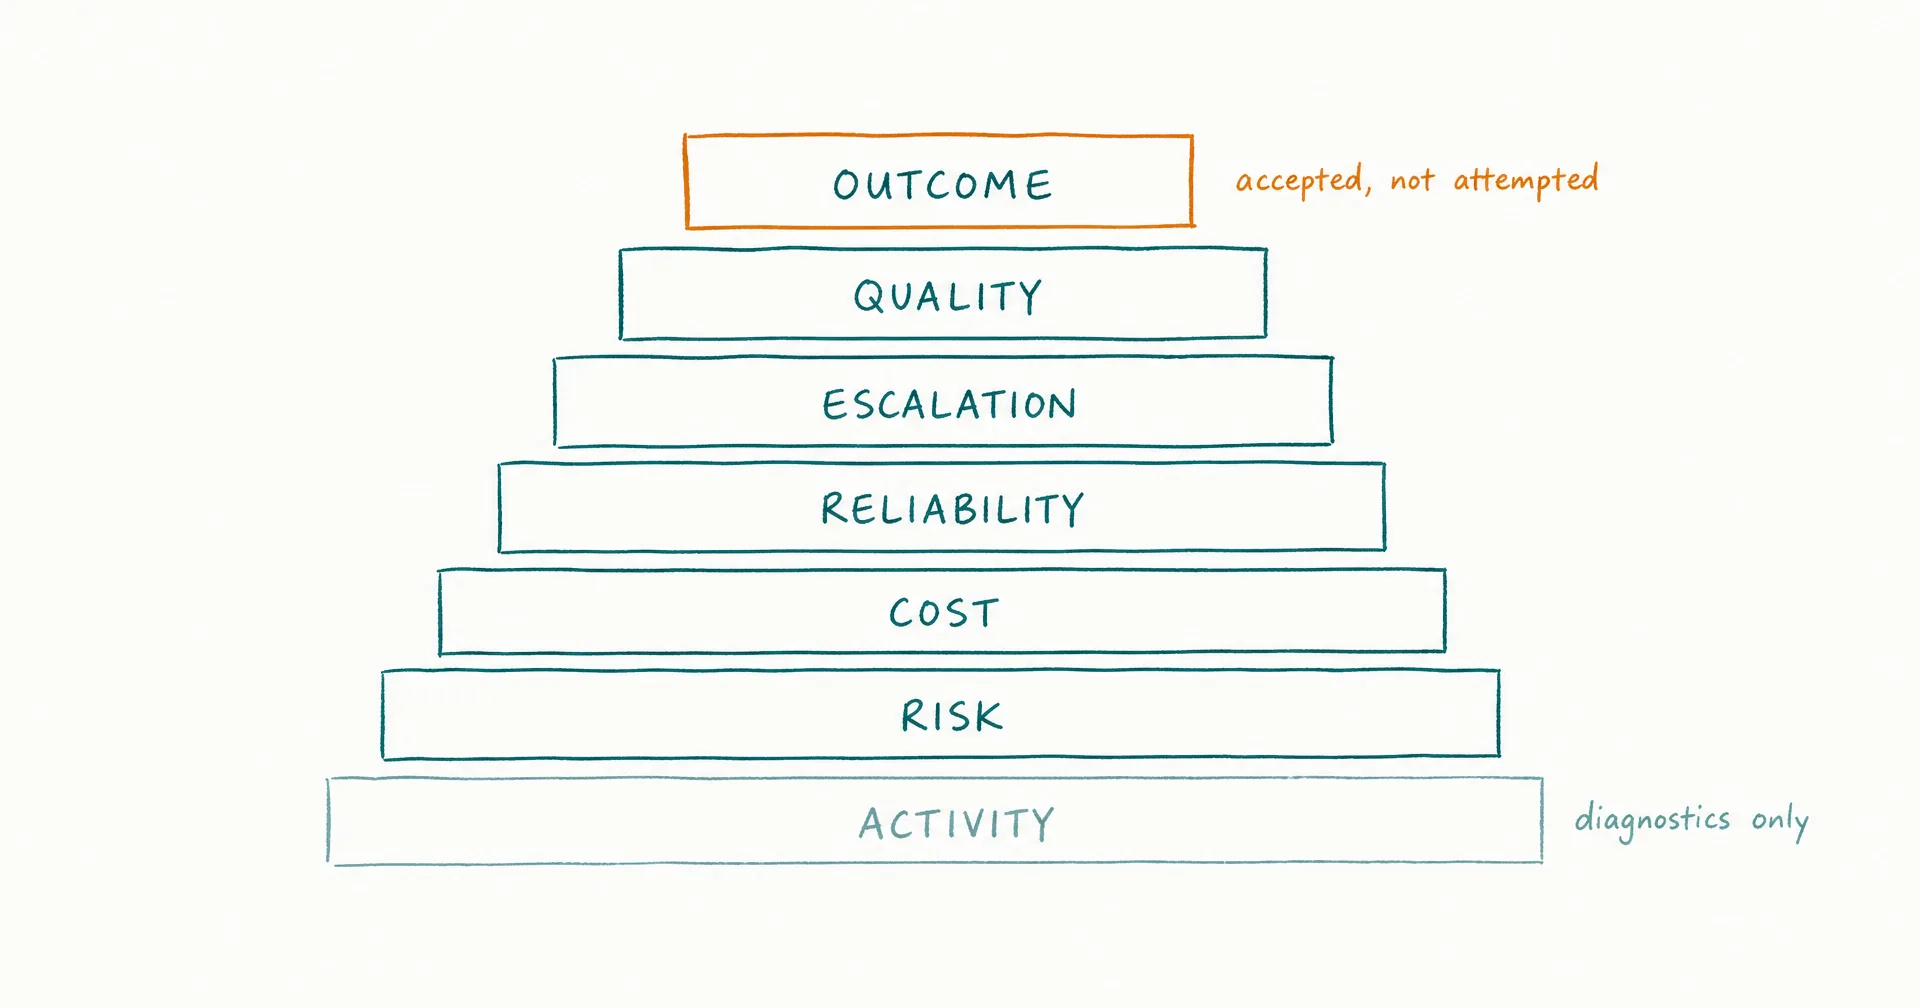
The best AI employee KPI is not tasks completed. It is the rate and value of accepted outcomes produced inside the role’s quality, escalation, risk, time, and cost boundaries.
Use a seven-part scorecard:
- business outcome;
- acceptance and quality;
- escalation and human control;
- flow and reliability;
- cost;
- risk; and
- activity diagnostics.
Activity explains what the worker did. It does not prove the work was useful. One hundred generated drafts can produce zero value if none are accepted. A high completion rate can hide missed exceptions, silent corrections, reopened work, or one severe incident.
A complete metric contract covers one recurring role. Goals, risk assessment, and complete ROI remain separate decisions.
On this page · 17 sectionsOpen
- AI Employee KPIs at a Glance
- What Is an AI Employee KPI?
- Why Are Tasks Completed a Weak Primary KPI?
- Which Outcome KPIs Should an AI Employee Have?
- Which Quality KPIs Matter?
- How Do You Measure Escalation Quality?
- Which Reliability and Flow KPIs Matter?
- Which Cost KPIs Should You Track?
- Which Risk KPIs Should You Track?
- Which Activity Metrics Are Useful?
- How Do You Write an AI Employee Metric Contract?
- What Should an AI Employee Dashboard Show?
- How Often Should AI Employee KPIs Be Reviewed?
- How Does CellCog Support AI Employee KPIs?
- What Does a Worked AI Employee KPI Scorecard Look Like?
- Common AI Employee KPI Mistakes
- Final Recommendation
- Define an accepted outcome before measuring the AI employee; “task completed” is only a system state.
- Use outcome, quality, escalation, reliability, cost, and risk KPIs together. Keep prompts, tokens, shifts, and tool calls as diagnostics.
- Track accepted without correction, accepted after correction, rejected, correctly escalated, falsely escalated, missed escalation, and reopened.
- Preserve error severity and worst-case failure beside averages; one high-impact miss can outweigh a strong acceptance rate.
- Calculate total cost per accepted outcome using platform, setup, integration, review, correction, monitoring, and failure exposure.
- In CellCog, map role goals, KPIs, task state, approvals, shifts, handovers, and dashboards into the organization’s metric contract; verify the current product implementation.
§ 01AI Employee KPIs at a Glance
| KPI layer | Primary question | Example metric | Why it matters |
|---|---|---|---|
| 1. Outcome | Did the business receive the intended result? | Accepted outcomes/week | Connects work to role purpose |
| 2. Quality | Was the result usable and evidence-complete? | First-pass acceptance | Exposes hidden correction |
| 3. Escalation | Did the right cases reach a person? | Escalation recall/precision | Measures control quality |
| 4. Flow/reliability | Did work finish consistently? | Cycle time, reopen rate | Detects queues and brittle completion |
| 5. Cost | What did usable work cost? | Total cost/accepted outcome | Normalizes economics |
| 6. Risk | What harm or policy failure occurred? | Incidents by severity | Preserves tail risk |
| 7. Activity | What resources and actions explain results? | Runs, credits, tool calls | Diagnoses, not proves, performance |
A launch dashboard should show at least one measure from the first six layers. Activity metrics support diagnosis after a result changes.
§ 02What Is an AI Employee KPI?
An AI employee KPI is a decision-linked measure that shows whether a standing AI role is producing its accepted outcome within defined quality, control, time, cost, and risk boundaries.
A complete KPI has:
| Field | Question |
|---|---|
| Role/outcome | Which responsibility is being measured? |
| Metric | What exactly is counted or calculated? |
| Numerator | Which events/values are included? |
| Denominator | Received, completed, accepted, customer, period, or cost? |
| Source | Which system or review record supplies the data? |
| Owner | Who is accountable for accuracy and action? |
| Cadence | Per task, shift, week, or month? |
| Threshold | What triggers advance, hold, narrow, pause, or stop? |
| Segment | Which task subtype, channel, risk class, or customer group? |
| Anti-gaming rule | How could the number improve while work worsens? |
“Quality score” without a rubric, denominator, source, and decision is not a KPI contract.
Goal versus KPI
A goal states the outcome and constraint:
Deliver a source-backed competitor-change briefing every Friday by 2:00 p.m., covering the approved 12 companies, with material changes and unresolved conflicts visible.
KPIs measure whether the role achieves it: accepted brief delivered on time; required-source completeness; material-change recall; unsupported-claim rate; reviewer/correction minutes; escalation precision; cost per accepted brief; and worst-error severity.
Define the objective separately, then use the measurement system to test whether the role achieves it.
KPI versus metric
Every KPI is a metric; not every metric is a KPI.
KPI: accepted briefs delivered on time. Supporting quality metric: claims with required source. Diagnostic: web tool calls per brief. Log field: model/mode version.
Do not fill the executive dashboard with every available counter.
KPI versus evaluation
An evaluation tests performance on a defined case or set. A KPI tracks live operating performance over time.
Use evaluations before launch; before permission expansion; after material change; for regression testing; and after a failure. Use KPIs per shift; weekly; monthly; by task subtype; and at operating reviews.
The two should connect. If a live KPI falls, rerun or extend the relevant evaluation cases.
§ 03Why Are Tasks Completed a Weak Primary KPI?
Completion is self-reported by the work system unless a downstream user or postcondition verifies it.
A task can be marked complete when output exists but is unusable; required sources are missing; the reviewer repairs it silently; an action call succeeded but the business state did not change; the customer reopens the issue; an exception should have escalated; duplicate work was produced; the wrong task was completed; or the result arrived too late.
Separate seven outcome states
Track:
- Accepted without correction
- Accepted after correction
- Rejected
- Correctly escalated
- Falsely escalated
- Missed escalation
- Reopened
A role may also have canceled, duplicate, expired, or out-of-scope states. Keep them outside completed/accepted unless the contract says otherwise.
Define accepted
An accepted outcome satisfies the role’s completion contract; meets the quality rubric; uses required evidence; stays inside permissions; reaches the downstream user/system; receives the required approval; passes its postcondition; and does not require undisclosed material repair.
For a draft role, acceptance may mean an editor approves the draft - not that the content was published.
Use the correct denominator
| Metric | Formula | What it answers |
|---|---|---|
| Completion rate | Completed / received | Did the queue move? |
| First-pass acceptance | Accepted without correction / completed | Was output usable immediately? |
| Total acceptance | (Accepted + accepted after correction) / completed | Did work become usable eventually? |
| Rejection rate | Rejected / completed | How much output had no usable value? |
| Reopen rate | Reopened / accepted | Did “done” remain done? |
| Accepted yield | Accepted outcomes / received | What share of demand became usable work? |
Report received, completed, and accepted counts beside rates. A 100% acceptance rate based on one easy case should not look like mature performance.
Record correction separately
If the reviewer changes facts, reasoning, policy application, audience, action, or structure, record the correction category; minutes; severity; who corrected it; whether the issue was detectable; whether a rerun was required; and whether the fix became a new evaluation case.
Silent correction makes weak automation appear strong.
§ 04Which Outcome KPIs Should an AI Employee Have?
Choose one primary accepted-outcome KPI and one business-result measure.
Primary accepted-outcome KPI
Examples: accepted research briefs delivered by deadline; accepted support drafts per low-risk ticket received; reconciled reports with verified postconditions; qualified research packets accepted by sales; approved content drafts that pass source and brand review; accurately routed exceptions resolved within policy; and task handovers accepted by the next owner.
The count must represent a useful unit, not any artifact.
Business-result measure
Connect the role to a downstream result without claiming causation prematurely:
| Role | Accepted outcome KPI | Downstream measure |
|---|---|---|
| Research | Accepted decision briefs | Decisions supported or analyst capacity released |
| Support | Accepted triage/draft packets | Resolution time, recontact, satisfaction |
| Sales research | Accepted account packets | Meetings assisted, conversion by qualified segment |
| Content | Accepted source-backed drafts | Qualified traffic, assisted pipeline, correction rate |
| Operations | Accepted exception packets | Resolution time, reopened cases, leakage avoided |
| Data | Reconciled report refreshes | Decision latency, data defects found |
Keep the accepted outcome as the worker’s direct KPI. Treat downstream metrics as shared or influenced when people, market conditions, or other systems also determine the result.
Use contribution boundaries
Do not assign total revenue, customer satisfaction, or company growth to one AI employee unless a credible causal design supports it.
Use labels: owned (role directly produces the accepted unit); shared (role and human/team jointly determine result); influenced (role contributes evidence or capacity); diagnostic (metric explains operation).
This stops the role from optimizing an outcome it cannot control.
§ 05Which Quality KPIs Matter?
Quality is multidimensional. One subjective 1-5 score hides the failure.
| Quality metric | Formula/rule | Failure detected |
|---|---|---|
| First-pass acceptance | Accepted without correction / completed | General usability |
| Evidence completeness | Required evidence present / required evidence | Missing support |
| Factual error rate | Outputs with material factual error / reviewed outputs | Incorrect claims |
| Policy adherence | Cases following required policy / applicable cases | Process violation |
| Format completeness | Required fields present / required fields | Incomplete handoff |
| Correction minutes | Total correction minutes / accepted outcomes | Hidden human labor |
| Reviewer agreement | Same-score cases / double-reviewed cases | Rubric ambiguity |
| Reopen rate | Reopened / accepted | Fragile completion |
| Postcondition pass | Intended verified results / actions | Tool/business mismatch |
Build a rubric
Use criteria with pass/fail or anchored levels: outcome completeness; factual/evidentiary correctness; source authority/freshness; policy compliance; reasoning/decision validity; format/channel; uncertainty disclosure; permissions; escalation; and downstream usability.
Define material and cosmetic corrections. Do not let grammar edits count like a wrong customer or unauthorized action.
Sample strategically
Review every high-impact item; every escalation; every new task subtype; every new source/tool/action; all failures; a random sample of routine accepted work; and a targeted sample of cases near thresholds.
Sampling only the best outputs creates a marketing dashboard, not an operating control.
§ 06How Do You Measure Escalation Quality?
Escalation is a prediction and routing problem. The worker must raise cases that need a person without sending every case to the human queue.
Use a four-cell table:
| Actual need for escalation | Worker escalates | Worker does not escalate |
|---|---|---|
| Yes | Correct escalation | Missed escalation |
| No | False escalation | Correct independent handling |
Then calculate: escalation recall = correct escalations / all cases that required escalation. Escalation precision = correct escalations / all escalations raised.
Why recall and precision both matter
Low recall means the worker misses important cases. Low precision means people spend time reviewing routine cases.
Set different thresholds by severity. Missing a high-impact case can be unacceptable even if overall recall is high.
Measure the escalation packet
Score whether the packet includes the case and current state; the trigger; sources; the policy/decision boundary; uncertainty; attempted steps; options and tradeoffs; the recommended next action; the deadline; the requested decision; and whether work is paused or safely continuing.
An escalation that says “I’m unsure” without evidence may be safe but operationally weak.
Measure response and closure
Track time from trigger to escalation; time waiting for a human; approver response time; decisions returned with enough clarity; cases resumed correctly; repeated escalations for the same unresolved rule; and handover of open escalation state.
Some escalation failures belong to the organization, not the AI employee. A missing owner or slow approval queue should not be mislabeled as model failure.
§ 07Which Reliability and Flow KPIs Matter?
Use flow metrics to detect queues, repeated work, and unreliable completion.
| Metric | Formula/definition | Use |
|---|---|---|
| Cycle time | Accepted time - received time | End-to-end speed |
| Active work time | Time actually processing | Execution efficiency |
| Waiting time | Time blocked on input/approval/system | Coordination bottleneck |
| Queue age | Current time - received time | Stale work |
| On-time rate | Accepted before deadline / due outcomes | Cadence reliability |
| Retry rate | Repeated attempts / initiated tasks | Tool/instruction instability |
| Duplicate rate | Duplicate outputs/actions / outcomes | Trigger/state failure |
| Handover reconciliation | Correctly continued open items / open items | Cross-shift continuity |
| Postcondition pass | Verified intended state / actions | Execution correctness |
Report median and a tail percentile such as p90 or p95 when volume supports it. An average can hide a small set of very late tasks.
The percentile choice and minimum sample should be predeclared. Do not report a p95 from a handful of observations as if it were stable.
Separate worker time from system waiting
If a task takes 18 hours because it waited 17 hours for approval, optimize the approval process before buying a faster model.
Segment cycle time into queue; active processing; tool/system wait; human approval; correction; retry; and downstream acceptance.
Track durable completion
Reopened tasks, corrected reports, bounced messages, rolled-back changes, and repeated customer contact show that “done” did not hold.
Use a durability window appropriate to the outcome. A support case may reopen within days; a monthly report can fail when the next refresh cannot reproduce it.
§ 08Which Cost KPIs Should You Track?
Measure total cost per accepted outcome, not credits or plan price alone.
Use: total cost per accepted outcome = total role cost / accepted outcomes.
Total role cost includes platform/subscription; variable usage and tools; setup amortization; integrations and administration; human review; correction and rework; monitoring/governance; and expected failure exposure.
The AI employee cost framework defines each layer and worked examples.
Track direct and operating cost separately
| Cost metric | Formula | Decision |
|---|---|---|
| Direct usage/outcome | Platform + tools / accepted | Compare execution consumption |
| Review cost/outcome | Review hours x loaded rate / accepted | Detect oversight burden |
| Correction cost/outcome | Repair/rerun cost / accepted | Detect hidden quality cost |
| Total cost/outcome | All cost layers / accepted | Compare complete economics |
| Unused-capacity rate | Unused eligible capacity / purchased | Right-size plan |
| Cost variance | Actual - budget | Detect drift |
Do not bury reviewer labor inside “existing payroll.” Record capacity released separately from cash savings.
When several AI roles share the same supervisors, the human span-of-control workload model converts review, exception, approval, correction, and peak-queue demand into a portfolio capacity limit.
Segment cost by task subtype
A role may look economic overall while one subtype consumes most review and retries.
Segment by normal versus exception; channel; output format; source/tool; customer/account tier; permission state; model/mode; accepted/rejected; severity; and new versus familiar case.
Use the segment to narrow or redesign the role rather than average expensive failure into cheap routine work.
§ 09Which Risk KPIs Should You Track?
Risk metrics preserve consequence that averages hide.
Severity model
Use an organization-specific scale. An illustrative model:
| Severity | Description | Example response |
|---|---|---|
| S0 | No issue | Record pass |
| S1 | Cosmetic/low-cost correction | Fix and trend |
| S2 | Material error contained before external impact | Correct and add regression |
| S3 | External, financial, privacy, security, or reputation impact | Incident response |
| S4 | Severe rights, safety, legal, or irreversible impact | Immediate containment/escalation |
These labels are an illustrative operating scale, not a universal standard.
Risk measures
Track incidents by severity; policy violations; prohibited-action attempts; approval bypasses; sensitive-data exposure; wrong-target actions; rollback/recovery events; undetected errors found downstream; time to contain; repeated failure after correction; and maximum plausible loss/exposure.
Always show the highest severity beside incident rate.
Measure controls, not just failures
| Control metric | What it shows |
|---|---|
| Required approvals obtained | Gate execution |
| Denied out-of-scope attempts | Boundary behavior |
| Revocation test passed | Containment readiness |
| Recovery test passed | Reversibility |
| Access review completed | Permission freshness |
| Regression set passed | Change safety |
| Incident action completed | Closure discipline |
The permission and approval matrix defines the action boundary. KPI reporting should show whether it worked in practice.
Keep risk as a gate
Do not create one weighted score in which fast, cheap output compensates for a severe control failure.
Use mandatory gates such as zero unresolved S3/S4 incidents; no missed escalation on defined critical cases; no approval bypass; no cross-tenant/customer access; recovery demonstrated before authority expansion; and immediate pause on prohibited action.
Thresholds must match the organization’s tolerance and applicable obligations.
§ 10Which Activity Metrics Are Useful?
Activity metrics explain performance but should not lead the scorecard.
Useful diagnostics include tasks received/started/completed; shifts/runs; messages; tokens/credits; tool calls; sources retrieved; context size; retries; steps; model/mode; media/file volume; execution time; memory reads/writes; approvals requested; and delegated subtasks.
Use activity to investigate change
Examples: accepted outcomes fall while tool calls rise; correction increases after a context/source change; cost rises because retries doubled; false escalations rise after a policy update; cycle time rises because human wait grew; duplicate actions follow a new trigger; or one mode consumes more credits without improving acceptance.
The diagnostic explains where to look. It is not the business result.
Reject vanity metrics
Do not use as a primary value claim: prompts answered; hours “worked”; tasks attempted; words generated; messages sent; dashboards created; agents delegated; tools connected; or outputs produced.
More activity can increase cost and risk while reducing accepted value.
§ 11How Do You Write an AI Employee Metric Contract?
Write the contract before the pilot so the role cannot redefine success after seeing results. The AI employee pilot guide turns that contract into a baseline, representative case pack, staged operating modes, evidence gates, and a precommitted go/revise/switch/stop decision.
Metric contract template
| Field | Example |
|---|---|
| Role | Competitive Intelligence AI Employee |
| Outcome | Accepted weekly competitor-change brief |
| Received unit | One scheduled weekly cycle |
| Accepted unit | Brief passes editor rubric and deadline |
| Primary KPI | Accepted briefs delivered on time |
| Quality | Evidence completeness; material-error rate |
| Escalation | Recall/precision on material/conflicting changes |
| Flow | Cycle time; waiting-on-owner |
| Cost | Total cost/accepted brief |
| Risk | Worst severity; prohibited action |
| Diagnostics | Credits, web calls, retries |
| Segments | Competitor, change type, source |
| Owners | Strategy lead; reviewer; system owner |
| Cadence | Per brief + monthly role review |
| Gates | Advance/hold/narrow/pause rules |
Define data events
Create consistent events: received; started; blocked; escalated; draft completed; reviewed; corrected; accepted; rejected; action attempted; postcondition passed/failed; reopened; incident opened/closed; and handover.
Each event needs role, task, subtype, timestamp, current state, owner, and relevant version.
Define attribution
If several agents and people contribute, record the originator; current owner; delegated worker; reviewer; approver; executor; accepted by; and final business owner.
Avoid crediting every participant with the whole outcome.
Define decision rules
For every KPI, state the threshold; minimum sample; severity override; trend window; alert; owner response; advance/hold/narrow/pause/stop; and required retest.
A dashboard without a decision rule is reporting, not management.
§ 12What Should an AI Employee Dashboard Show?
Use a small decision dashboard with drill-down.
Executive view
| Section | Current | Target/gate | Trend | Owner action |
|---|---|---|---|---|
| Accepted outcomes | 18 | >=16 | Up | Continue |
| First-pass acceptance | 78% | >=80% | Flat | Repair top correction |
| Escalation recall | 100% | 100% critical cases | Stable | Continue |
| Escalation precision | 67% | >=70% | Down | Clarify exception rule |
| Median correction | 8 min | <=10 min | Stable | Continue |
| On-time | 94% | >=95% | Up | Review late subtype |
| Cost/accepted | $42 | <=$45 | Down | Continue |
| Worst severity | S2 | No unresolved S3/S4 | Stable | Close regression |
All numbers in this table are illustrative.
Drill-down
Allow filtering by task subtype; time period; source/tool; model/mode; customer/account segment; reviewer; accepted/corrected/rejected; escalation state; permission state; and severity.
Keep representative examples behind each number. A team should be able to open the corrected and failed cases, not only see the rate.
Anti-gaming checks
| KPI | How it can be gamed | Countermeasure |
|---|---|---|
| Acceptance | Lower rubric or review less | Fixed rubric + sampling |
| Cycle time | Close incomplete work | Postcondition + reopen rate |
| Escalation recall | Escalate everything | Track precision and wait |
| Cost/outcome | Exclude review/correction | Total-cost ledger |
| On-time | Reject difficult cases | Received-to-accepted yield |
| Error rate | Review only easy work | Risk-weighted sampling |
| Output count | Split one outcome into many | Fixed unit definition |
Metrics shape behavior. Review the loophole before rewarding the number.
§ 13How Often Should AI Employee KPIs Be Reviewed?
Use layered cadences.
| Cadence | Review |
|---|---|
| Per action/task | Acceptance, evidence, escalation, postcondition, severity |
| Per shift | Queue, blockers, retries, handover, cost |
| Weekly during pilot | Outcome, quality, review/correction, exceptions, incidents |
| Monthly when stable | Role scope, trend, economics, access, source/tool drift |
| After material change | Regression tests plus affected KPI baseline |
| After incident | Containment, root cause, controls, threshold, re-entry |
| Before expansion | Representative evidence and severity gate |
The onboarding guide uses the same evidence to decide whether authority advances. Do not expand because a calendar milestone arrived.
NIST’s AI RMF Core calls for ongoing monitoring and periodic review, defined human-AI oversight roles, measurable improvement, incident response, recovery, change management, and decommissioning. The exact KPI cadence should follow the role’s impact and change rate.
Use control limits, not constant reaction
For stable high-volume metrics, define the normal range; warning threshold; pause threshold; severity override; and minimum sample.
Do not change instructions after every routine fluctuation. Investigate sustained or severe changes.
Rebaseline carefully
Rebaseline when the role scope changes; the task subtype changes; a source/tool changes; the model/mode changes; approval/permission changes; the reviewer/rubric changes; the business process changes; or the outcome value changes.
Preserve the prior baseline and explain the break. Otherwise improvement can be manufactured by changing the denominator.
Retire metrics that no longer drive decisions
A metric creates maintenance work: events must be captured, definitions governed, edge cases resolved, and dashboards reviewed. Remove or demote it when nobody owns the response; the measure duplicates another KPI; the denominator cannot be reproduced; the role no longer controls or influences it; the metric has become a target that degrades real work; a changed process makes historical comparison invalid; or the diagnostic has not informed a decision across several relevant review periods.
Do not delete the historical definition. Mark the metric retired, record the reason and date, preserve the prior series where required, and identify any replacement.
Before adding a KPI, ask:
- Which decision changes when it crosses the threshold?
- Who will make that decision?
- Can the underlying cases be inspected?
- What behavior might the KPI reward unintentionally?
- Which higher-priority measure prevents that gaming?
If there is no decision, the number belongs in exploration or diagnostics - not the management scorecard.
Review the scorecard with the people who receive, correct, approve, and act on the work. A metric can be technically reproducible and still omit the burden experienced downstream.
§ 14How Does CellCog Support AI Employee KPIs?
CellCog’s AI Employees page describes goals, KPIs, task lists, shifts, approvals, memory, handovers, and live dashboards as part of its employee model.
Map those surfaces into the metric contract:
| CellCog surface | KPI use | Buyer verification |
|---|---|---|
| Goal/KPI configuration | State intended outcome | Formula, threshold, owner |
| Task list/board | Received, state, blocker, completion | Accepted state exists outside self-report |
| Shifts | Period/cadence | Start/end and task attribution |
| Approvals | Human-control events | Request, decision, expiry, result |
| Memory/context | Version/change segment | Source and memory change visible |
| Handover | Open-work continuity | Next owner accepts state |
| Dashboard | Decision view | Definitions and drill-down available |
| Credits/usage | Cost diagnostic | Role/time attribution export |
Use the current AI Employees guide to verify live behavior. Public product descriptions do not prove that every formula, segment, export, or custom dashboard field exists in the current account.
Do not use CellCog’s company metrics as your role KPI
CellCog publishes first-party organizational and product metrics elsewhere. Those may illustrate how CellCog describes its own operation, but they do not establish your baseline; your accepted outcome; your reviewer burden; your error rate; your economics; or your risk tolerance.
Build the role dashboard from your process evidence.
Keep an organization-owned ledger
If the platform does not expose a required metric directly, maintain the task ID and subtype; received/completed/reviewed timestamps; acceptance state; correction; escalation; source/tool/version; usage/cost; postcondition; severity; and owner.
The organization must be able to compare the role even if the vendor, plan, or interface changes.
§ 15What Does a Worked AI Employee KPI Scorecard Look Like?
The following examples are illustrative. They show formulas and decisions, not CellCog results or industry benchmarks. For what a scoped capability claim looks like, see the dated DeepResearch Bench standings - benchmark evidence is a different object from a role KPI.
Example 1: weekly research role
The role owns one accepted competitor-change brief per week.
During one four-week period: 4 briefs received; 4 completed; 3 accepted without correction; 1 accepted after 15 minutes of correction; 48 required claim-source pairs; 47 present and valid; 2 cases required escalation; both were escalated; 1 additional false escalation; no briefs reopened; $320 total role cost; and worst observed issue S1.
| KPI | Calculation | Result | Decision |
|---|---|---|---|
| Accepted yield | 4 accepted / 4 received | 100% | Pass |
| First-pass acceptance | 3 / 4 completed | 75% | Improve |
| Evidence completeness | 47 / 48 | 97.9% | Review missing-source cause |
| Escalation recall | 2 / 2 required | 100% | Pass |
| Escalation precision | 2 / 3 raised | 66.7% | Clarify one false trigger |
| Correction/outcome | 15 minutes / 4 | 3.75 minutes | Pass if below gate |
| Cost/accepted brief | $320 / 4 | $80 | Compare with baseline/value |
| Reopen rate | 0 / 4 | 0% | Pass |
| Worst severity | Maximum | S1 | Inside illustrative tolerance |
The headline is not “100% completed.” The decision is more specific: the role produced every accepted brief and escalated every required case, but first-pass quality and one false escalation still need repair.
Use the best-task suitability framework before treating this scorecard as a reason to expand the role. A strong score on one bounded research outcome does not qualify public publishing, customer outreach, or unrelated analysis.
Example 2: support triage and draft role
The role receives 200 allowlisted low-risk tickets. It classifies each ticket and prepares a response draft. A person handles refunds, security issues, account changes, and exceptions.
Observed period: 200 received; 180 completed; 135 accepted without correction; 30 accepted after correction; 15 rejected; 20 still open at cutoff; 24 cases required escalation; 22 were correctly escalated; 8 other cases were falsely escalated; 9 accepted cases reopened; $2,475 total role cost; and one S2 issue contained before external impact.
| KPI | Calculation | Result | Interpretation |
|---|---|---|---|
| Completion | 180 / 200 | 90% | Queue movement only |
| Accepted yield | 165 / 200 | 82.5% | Usable output/demand |
| First-pass acceptance | 135 / 180 | 75% | Material review burden remains |
| Total acceptance | 165 / 180 | 91.7% | Eventual usability |
| Rejection | 15 / 180 | 8.3% | Diagnose by subtype |
| Escalation recall | 22 / 24 | 91.7% | Two required cases missed |
| Escalation precision | 22 / 30 | 73.3% | Eight unnecessary escalations |
| Reopen | 9 / 165 | 5.5% | Completion durability issue |
| Cost/accepted | $2,475 / 165 | $15 | Compare with current process |
| Worst severity | Maximum | S2 | Add regression and contain |
This role should not receive broader authority merely because total acceptance is 91.7%. The two missed escalations and the S2 case determine the next decision. Depending on their subtype and consequence, the team may hold, narrow, or return to shadow/draft mode.
Use the outcome-first hiring contract to confirm that low-risk classification and draft preparation - not final exception resolution - remain the role’s responsibility.
Diagnose the support example by subtype
Suppose the 15 rejections break down as:
| Subtype | Received | Rejected | Rejection rate |
|---|---|---|---|
| Order-status question | 70 | 1 | 1.4% |
| Product how-to | 60 | 2 | 3.3% |
| Billing clarification | 35 | 5 | 14.3% |
| Account/access issue | 15 | 7 | 46.7% |
The aggregate rejection rate does not justify treating all tickets alike. Keep order-status and product how-to in the pilot; narrow, repair, or human-route account/access issues. If billing clarification follows stable, explicit rules, compare deterministic workflow automation with an AI employee instead of solving every failure with more model autonomy.
Convert the scorecard into a decision
| Result | Action |
|---|---|
| Outcome, quality, escalation, cost, and risk pass | Continue at current authority |
| Quality close; no severe control failure | Hold and repair |
| One subtype passes; another repeatedly fails | Narrow the role |
| Cost fails but quality/risk pass | Right-size mode, process, or plan |
| Escalation or permission gate fails | Reduce authority and retest |
| Severe unresolved incident | Pause and contain |
| Stable rule explains most failures | Route that path to workflow automation |
The six-stage onboarding method defines how evidence changes authority. KPI review supplies the evidence; it does not automatically grant the next permission.
§ 16Common AI Employee KPI Mistakes
| Mistake | Why it misleads | Better measure |
|---|---|---|
| Tasks completed | Self-reported system state | Accepted yield |
| Output volume | More can mean more waste | Accepted outcomes |
| Accuracy alone | Hides severity and coverage | Rubric + severity |
| Acceptance alone | Hides silent correction | First-pass + correction time |
| Escalation count | High can be noise or safety | Recall + precision |
| Average cycle time | Hides tail delay | Median + p90/p95 |
| Platform cost only | Excludes human work/failure | Total cost/accepted |
| One composite score | Benefits offset severe risk | Separate risk gates |
| Company revenue | Attribution is weak | Owned outcome + influenced result |
| Benchmark score | Different task/distribution | Role-specific cases/live KPIs |
| Dashboard without samples | Cannot inspect failures | Linked evidence |
| Threshold after results | Encourages moving goalposts | Precommitted contract |
| No segmentation | Easy cases hide hard failures | Task/risk segments |
| Constant rebaseline | Erases regression | Versioned baseline |
§ 17Final Recommendation
Measure the work the business accepts, not the activity the AI produces.
Use seven layers: outcome + quality + escalation + reliability + cost + risk + diagnostics.
Start with accepted outcomes. Add correction burden, escalation recall and precision, durable completion, total cost per accepted outcome, and worst-error severity. Use tasks, shifts, credits, tool calls, and tokens only to explain why those results changed.
For CellCog, connect goals, KPIs, task state, shifts, approvals, handovers, dashboards, and usage into the same buyer-owned metric contract. Verify which fields and exports the current product exposes.
A role should expand only when its outcomes are accepted, its exceptions reach the right people, its cost remains viable, and its worst failures stay inside tolerance.
Q1What is the best KPI for an AI employee?
Use accepted outcomes per period, paired with first-pass quality, escalation, total cost, and worst-error severity. The exact accepted unit depends on the role.
Q2Should tasks completed be an AI employee KPI?
It can be a flow metric, but not the primary value KPI. Completion may hide rejection, correction, missed escalation, failed postconditions, or reopened work. Track accepted yield instead.
Q3How do you measure AI employee quality?
Use a written rubric covering completeness, facts/evidence, policy, decision validity, format, uncertainty, permission, escalation, and downstream usability. Track first-pass acceptance and correction minutes.
Q4How do you measure AI employee escalation?
Calculate recall - correct escalations divided by all cases that required escalation - and precision - correct escalations divided by all escalations raised. Preserve severity and measure packet quality, response time, and closure.
Q5How do you calculate AI employee cost per outcome?
Add platform, usage, setup, integration, review, correction, monitoring, and expected failure exposure, then divide by accepted outcomes. Do not divide by attempts or generated outputs.
Q6How many KPIs should an AI employee have?
Use the smallest set that covers outcome, quality, escalation, reliability, cost, and risk, with activity diagnostics behind it. One primary outcome KPI plus roughly one or two measures per control layer is often clearer than a large unprioritized dashboard.